Hi,
I am looking at the spend patterns panel summaries, and I noticed wired patterns regarding transaction types. I wonder if something is going wrong in classification or its reporting.
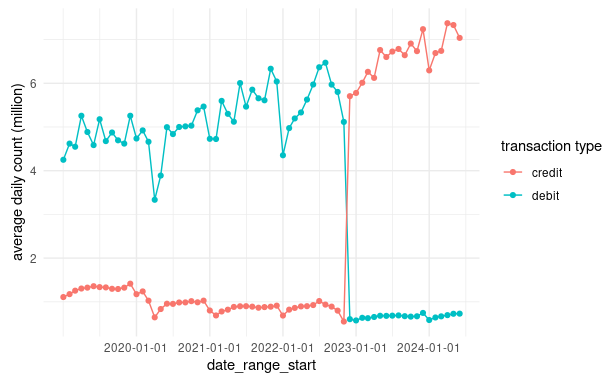
For the entire US, it looks like this:

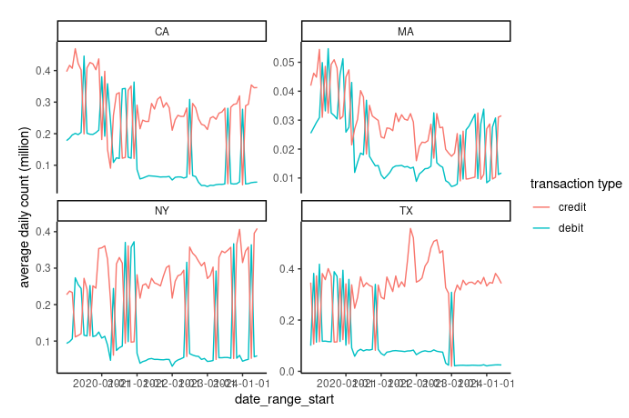
For some selected states, the swaps between the two types are more arbitrary in individual months:

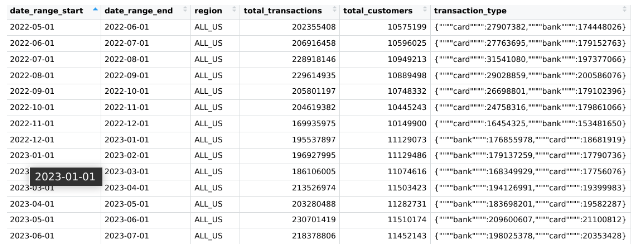
And lastly, I observed a significant scale shift in the raw data tables starting from December 2023 (entire US).

Could you please help clarify these discrepancies? Many thanks!
Best,
Binzhe