Hi Community,
Our research is related to a longitudinal analysis based on Dewey’s neighbood pattern and summary data. The data consistency over time is therefore important for us.
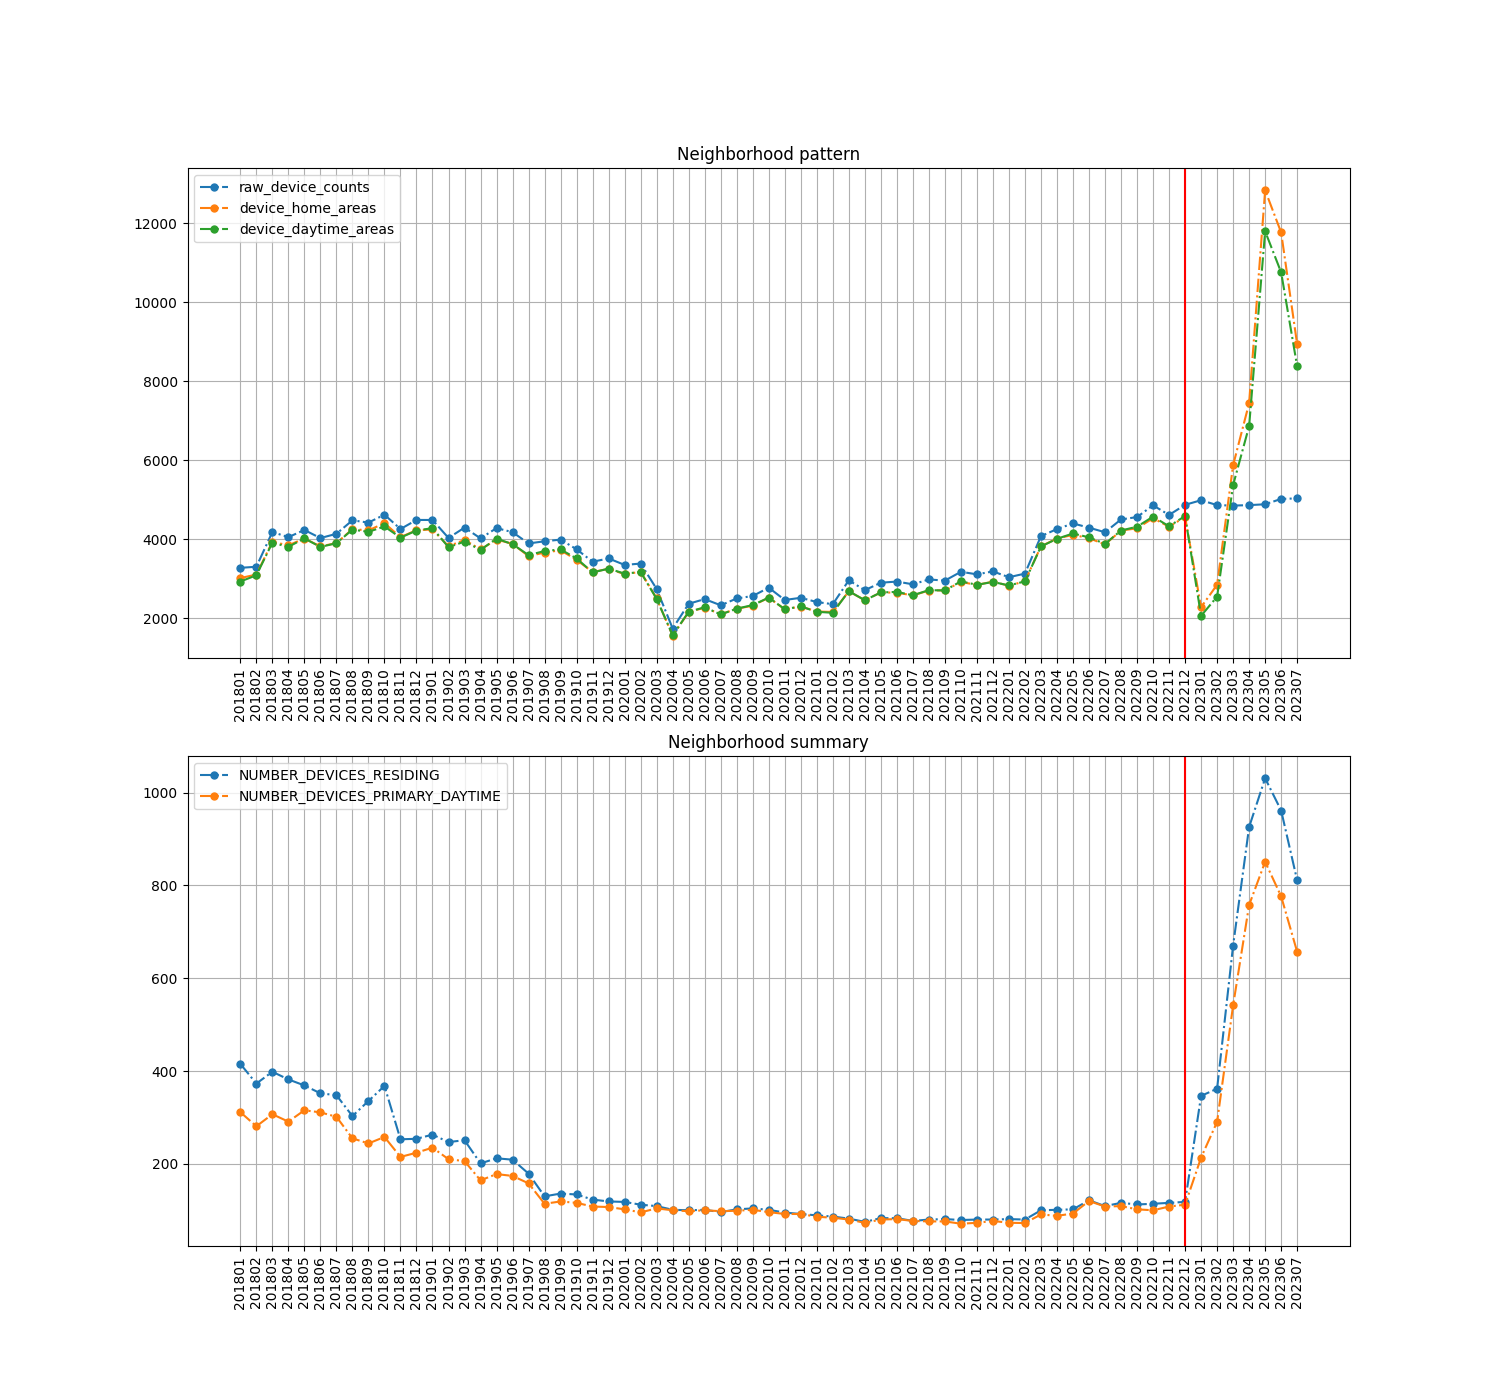
Since Jan 2023, Advan has become the data provider instead of Safegraph. The way to collect data may be changed according to our observation. The figure below shows the medians of the sums of the fields “raw_device_counts”, “device_home_areas” and “device_daytime_area” across months (from pattern dataset), also the “number_devices_residing” and “number_devices_primary_daytime” (from summary dataset). (Advan doc: Documentation (Public) - Google Drive)
I wonder:
- If there’s any explanation about the data collecting/processing procedures and the relation between these variables/fields,
- Also the dramatic variances of “number_devices_residing”, “number_devices_primary_daytime”, “device_home_areas” and “device_daytime_area” after Dec 2022, while “raw_device_counts” is always consistent.
Thank you!