ADVAN Monthly Patterns Data: abnormal drops starting Jan 2023?

@Binzhe_Wang_MIT we are going to do a restatement for the normalization files. Hang tight and I’ll update you when this is complete.

Hi Evan,

I also found that the neighborhood pattern and weekly pattern from Advan have abnormal drops and hikes. The figures below showed the medians of median_dwell(meddwell), raw_stop_counts(dest_nStops), raw_device_counts(dest_nDev), number_devices_residing(nDev_night) and number_devices_primary_daytime(nDev_day).


particularly, comparing to Dewey data it is much significant to see the drops for dest_nStops and dest_nDev, also the hikes for nDev_night and nDev_day.

Could you explained what conducts to such huge changes in the begining of 2023. Also when you estimated the data later than Jan 2023 will be released from Advan?

Can you explain what “Dewey” is in this case, vs “Advan”?

My mistake. It should be Safegraph vs Advan here.

The methodology and panel of these datasets are different and will continue to diverge over time so we’d encourage you not to try and compare them over time across attributes.

Advan 2023 data is available on the platform, although I believe we still need and updated summary files for NP.

Thank you Evan! We are indeed analyzing the trend over month. I will try to filter out the Shared Polygons.
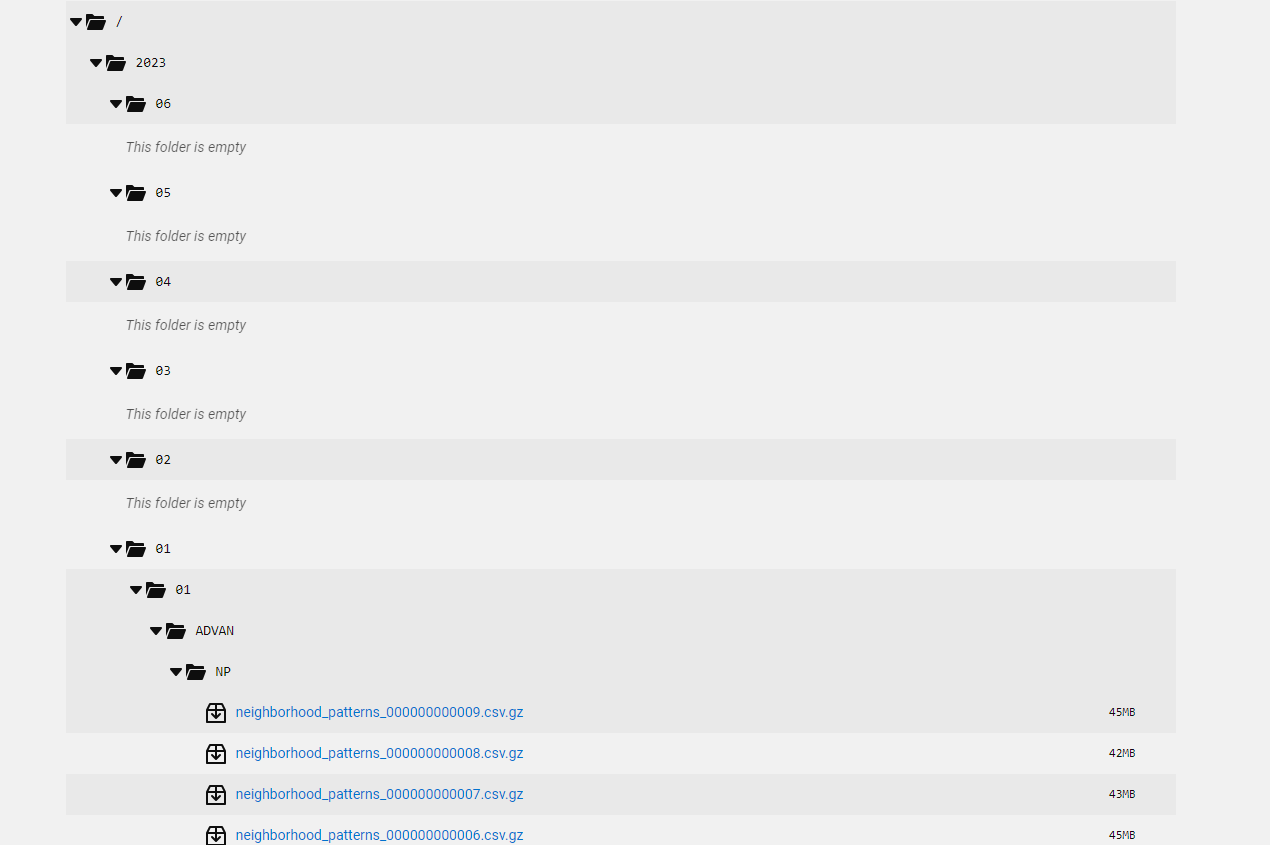
In my account under https://marketplace.deweydata.io/#/files. I only have data of Jan for year 2023 while the folders under Feb - Jun are empty. Is that normal or I missed something?

The “Subscribe” feature seems to be make blank folders show up. It should only add new updates to the data moving forward.

I’d encourage you to place an order for Historic Monthly data for the months you need.

Yep, that works with Historic Monthly data. Now I have data after Jan 2023 under my path. However, I’ve tried to click the panel data link of “neighborhood_home_panel_summary_000000000000.csv.gz”(https://marketplace.deweydata.io/api/data/v2/data/2023/01/01/ADVAN/NP/20230101-advan_np_us_hpanel_0) under my path:


And I got this:

How can I resolve it?

Now The link for panels work! Thank you for helping! But the hikes for nDev_night (number_devices_residing) and nDev_day (number_devices_primary_daytime) still look crazy. Just wanting to clarify here, I’d like to be sure that the new method of organizing data has been applied to the data since Jan 2023 or all the Advan data?


Advan is working on some updates to their normalization stats files starting in 01/2023 and we’ll soon be restating those files. It should help with the discrepancies starting at that date. Our hope is to get those new files live in the next two weeks.

We’ve published the restated version of Monthly Patterns but are still waiting on the Weekly Patterns data to be updated.

Here’s a list of Placekeys that have been dropped from the Advan data because of some issue with the Place. I recommend dropping these from any longitudinal analysis:

I just wanted to follow up on this. I downloaded December 2022 of Advan MP and it looks anomalous compared to other months. Half as many rows when I aggregate all the files, many fewer POIs in the data, and a total size of ~6 GB while most other months are about 20 (as an unzipped csv after I drop a bunch of columns, but either way, my process has been consistent this whole time). If you did end up refreshing the patterns data, how can we access the new files? If I order new data, nothing seems to change. Thanks so much for your help.

Hey @Andrew_Renninger_Penn our new product is launching this Wednesday with the new data loaded. Apologies for the inconvenience and thanks for your patience. You’ll get an email notification about the launch.

Excellent. Thanks.

You can try re-downloading the data on our new platform: https://app.deweydata.io/

This has the latest data from Advan, which will hopefully resolve some of the discrepancies you’re seeing.

Your community credentials should work as the log-in: Platform Updates FAQ

Hi Evan,
The new data still appears a bit “light” compared to the other months. December 2022 had 3.3GB of raw data in 14 files, while the month before and after had around 9.7 and 11GB of raw data.

Hi Evan— There is still a big drop in the new batch (December 2022): this dataset is only tracking 4 million POIs, about half the level from 2019 to 2021. Any idea what might have changed between those months?

Thanks @Martin_Andersen_UNC_Greensboro and @Andrew_Renninger_Penn, your feedback helps.

Have you tried removing the “excluded_placekeys” shared above from all of your pre-Dec 2022 data?

From my understanding, Advan started adding more checks to their data around Dec 2022 to test for and remove data because of “bad” polygons (i.e. polygons that now get denied by internal checks due to an unreasonable size/the number of vertices.). There are over 1m POI on that list which may make up for the difference.

Instead of backfilling the historic data and removing those, for now we just have the list but I can see if we can pre-remove these from our version of their data.

Alas, this appears to be a separate issue.

Outlook-vyxk2s0e.png