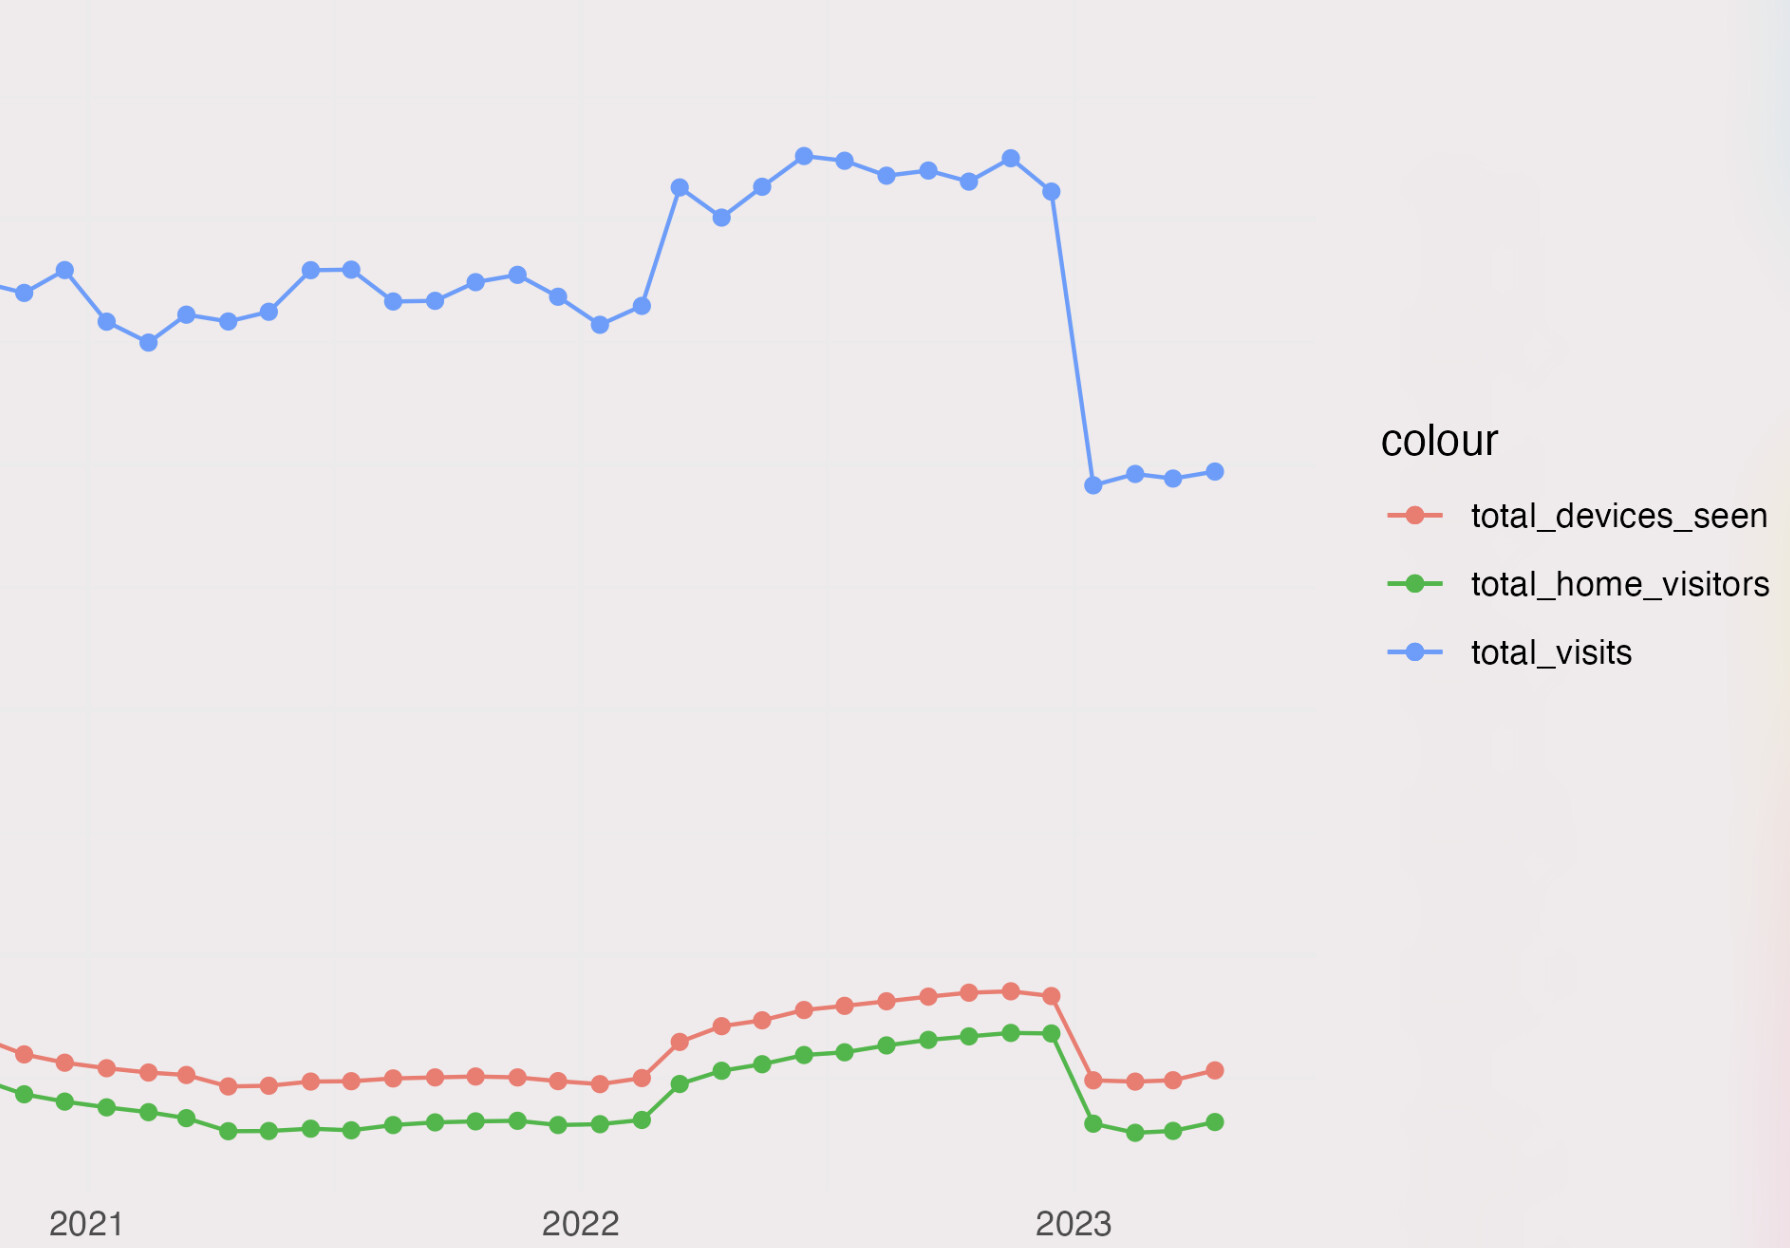
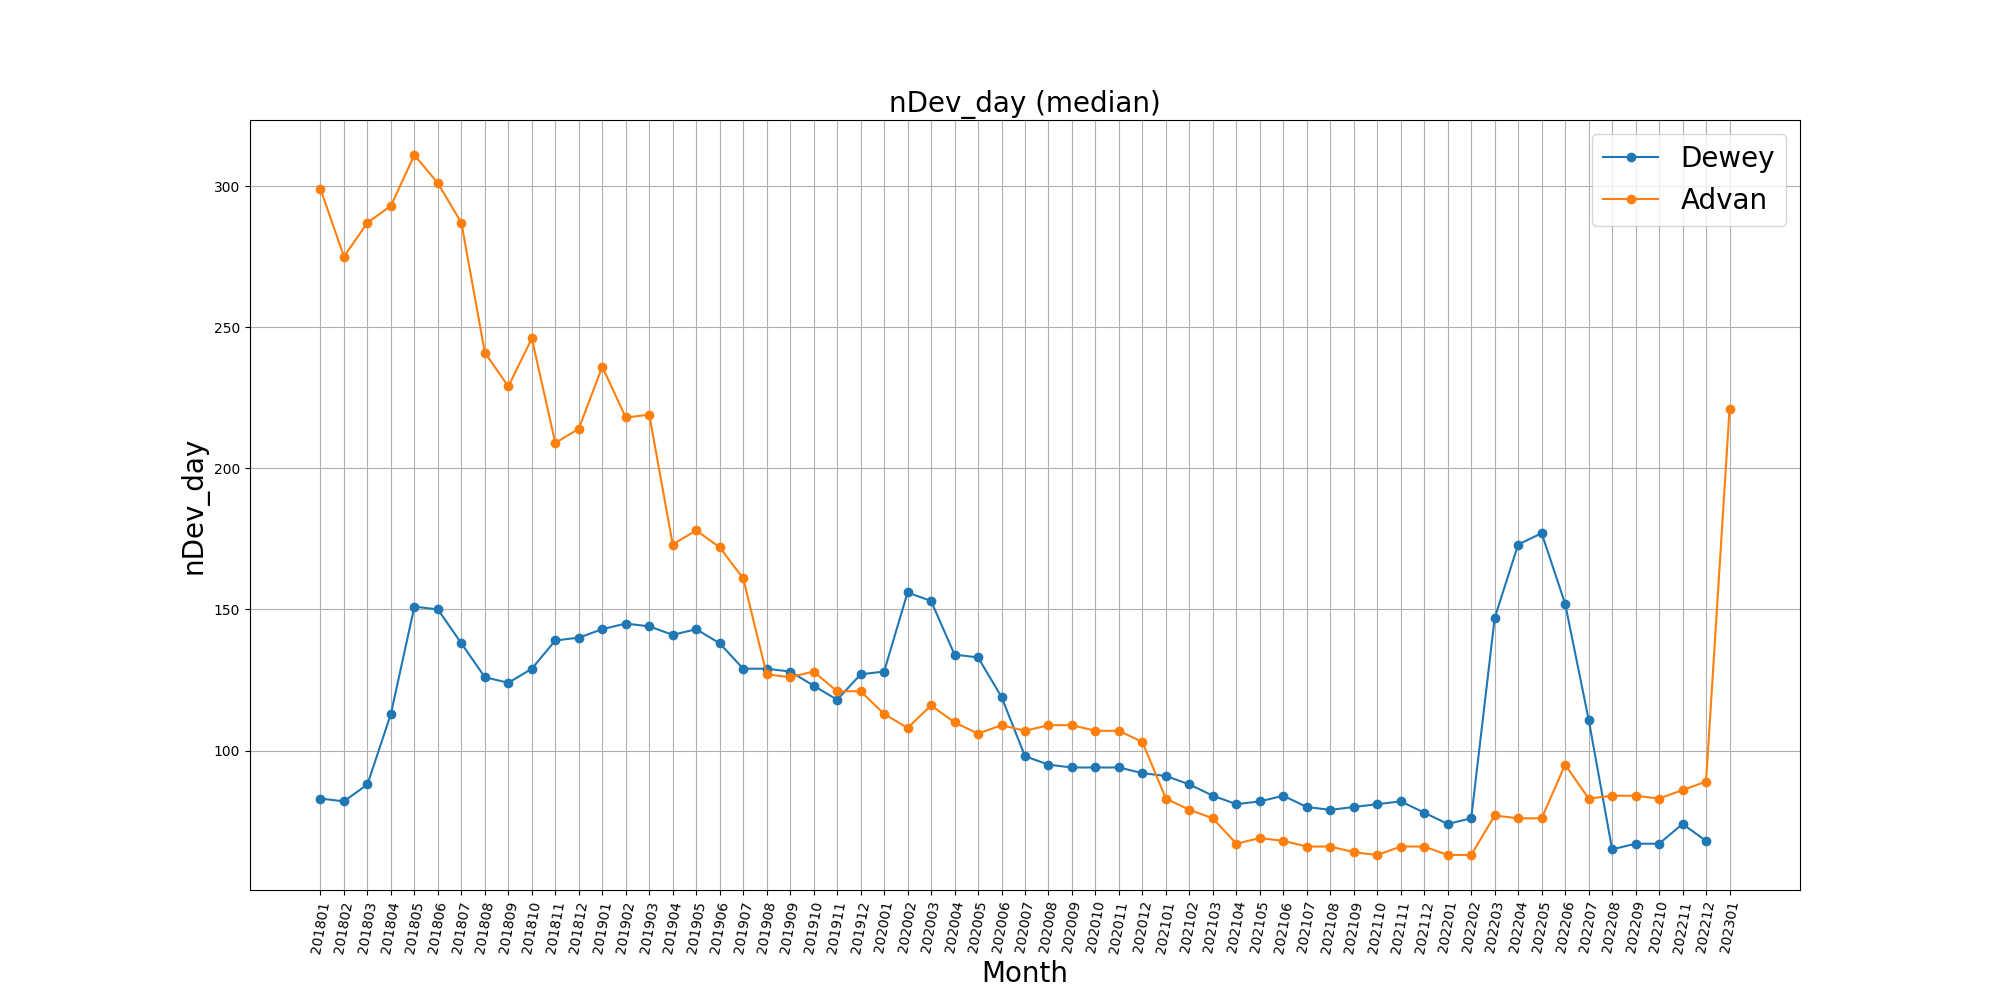
As shown in the figure below, I notice a significant discontinuity starting Jan 2023, and I believe there is a data issue.
Where can I find the technical notes of changes in samples/measures/methods starting Jan 2023, when SafeGraph and ADVAN merged? Is there any official correction method?
Hi @Binzhe_Wang_MIT - we’re actually working on a redelivery of the Patterns data for 2023 that I believe should alleviate your issue. The 2023 data was just redelivered to Dewey with significantly more “parts” (with smaller file sizes) than before, and those new parts were not loading into the product correctly so we were unintentionally delivering an incomplete dataset starting in 2023. We should have this resolved by Tuesday/Wednesday this week.
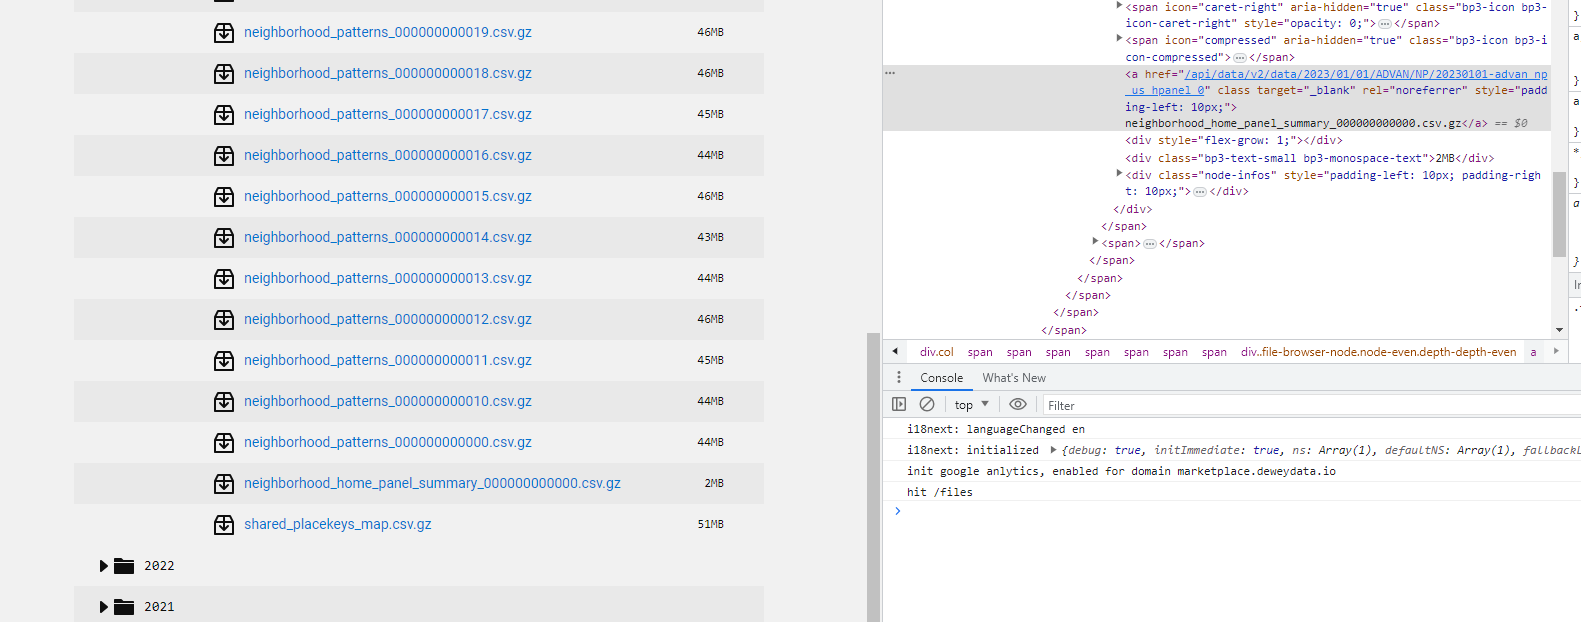
Hi @Binzhe_Wang_MIT the complete 2023 data should now be loaded. You’ll noticed more files starting in 2023, so be sure to adjust to that if you were programmatically pulling data based on the number of parts.
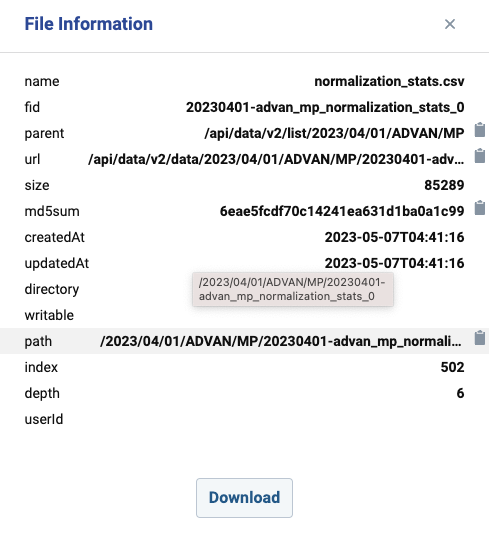
@evan_barry_dewey Hi Evan, thanks a lot for your help! I’ve redone the patterns with the new normalization_stats files from each month, but it seems the normalization files were not updated. Could you please help take a look if there is a new version of the normalization_stats files starting in 2023 too?
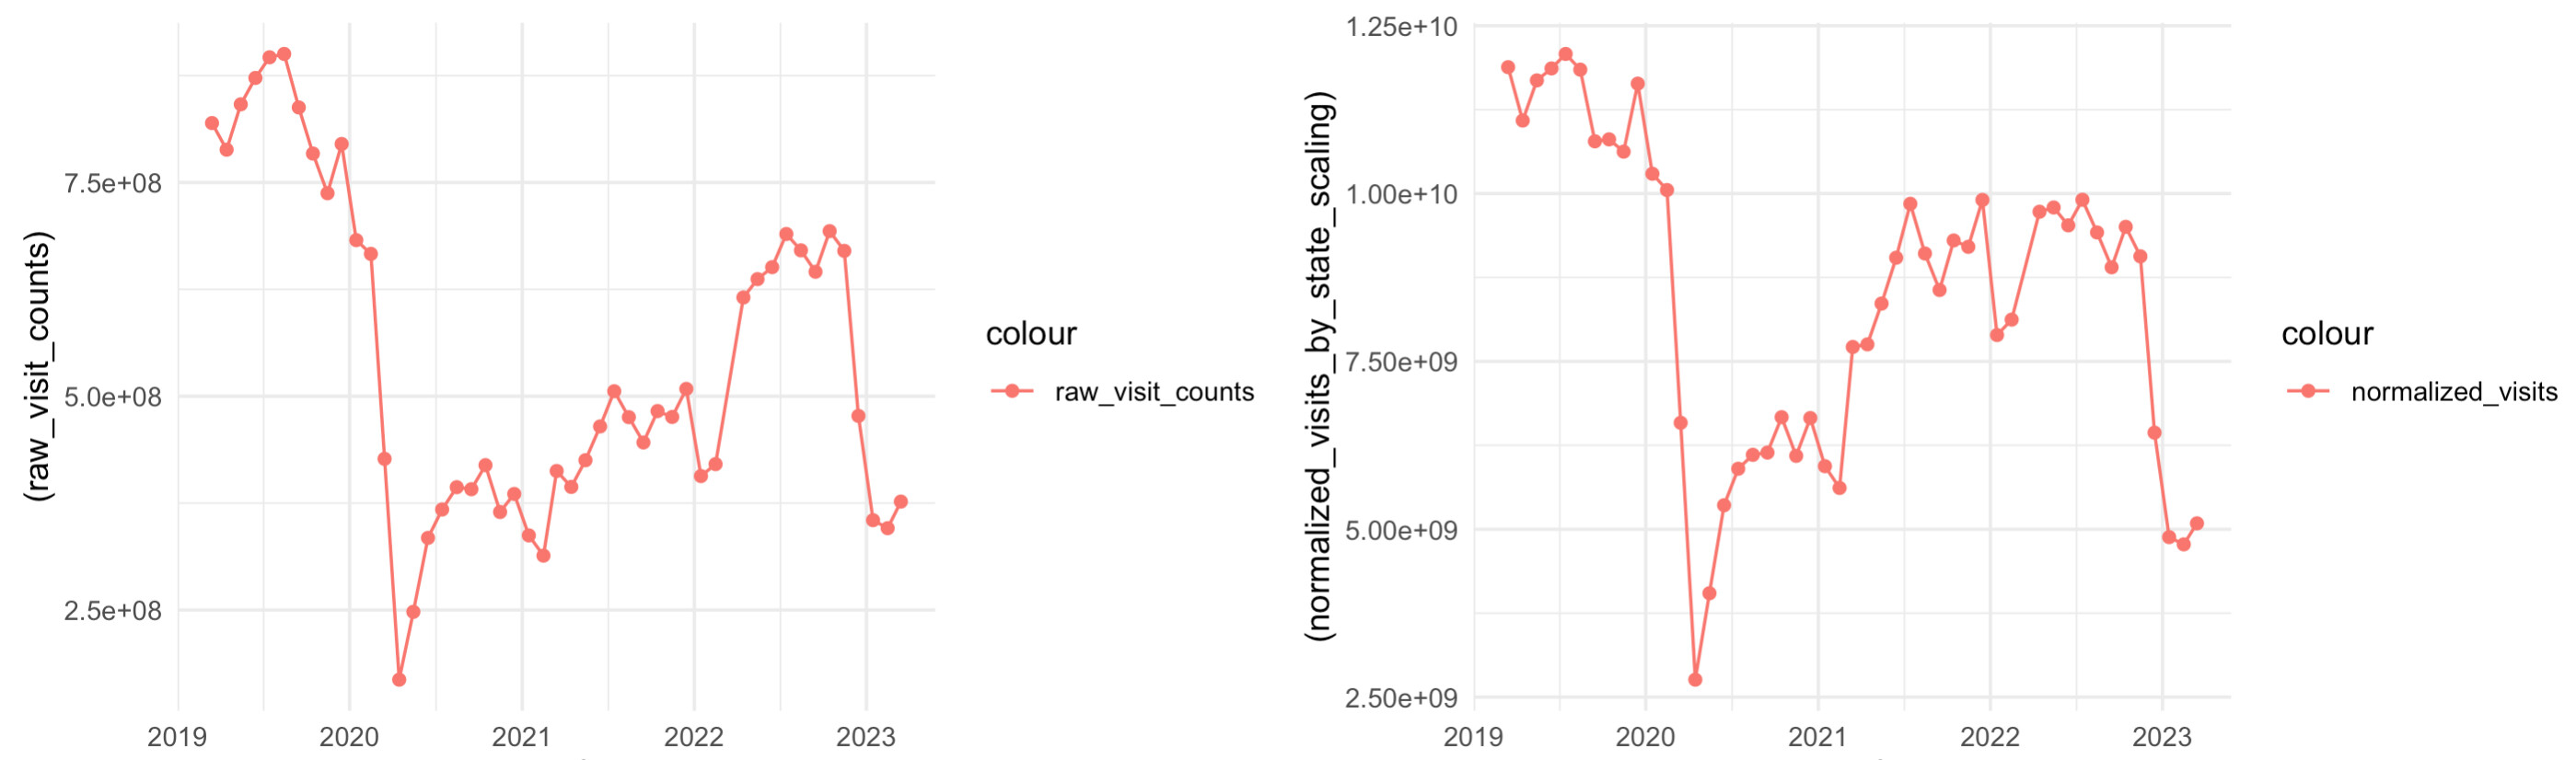
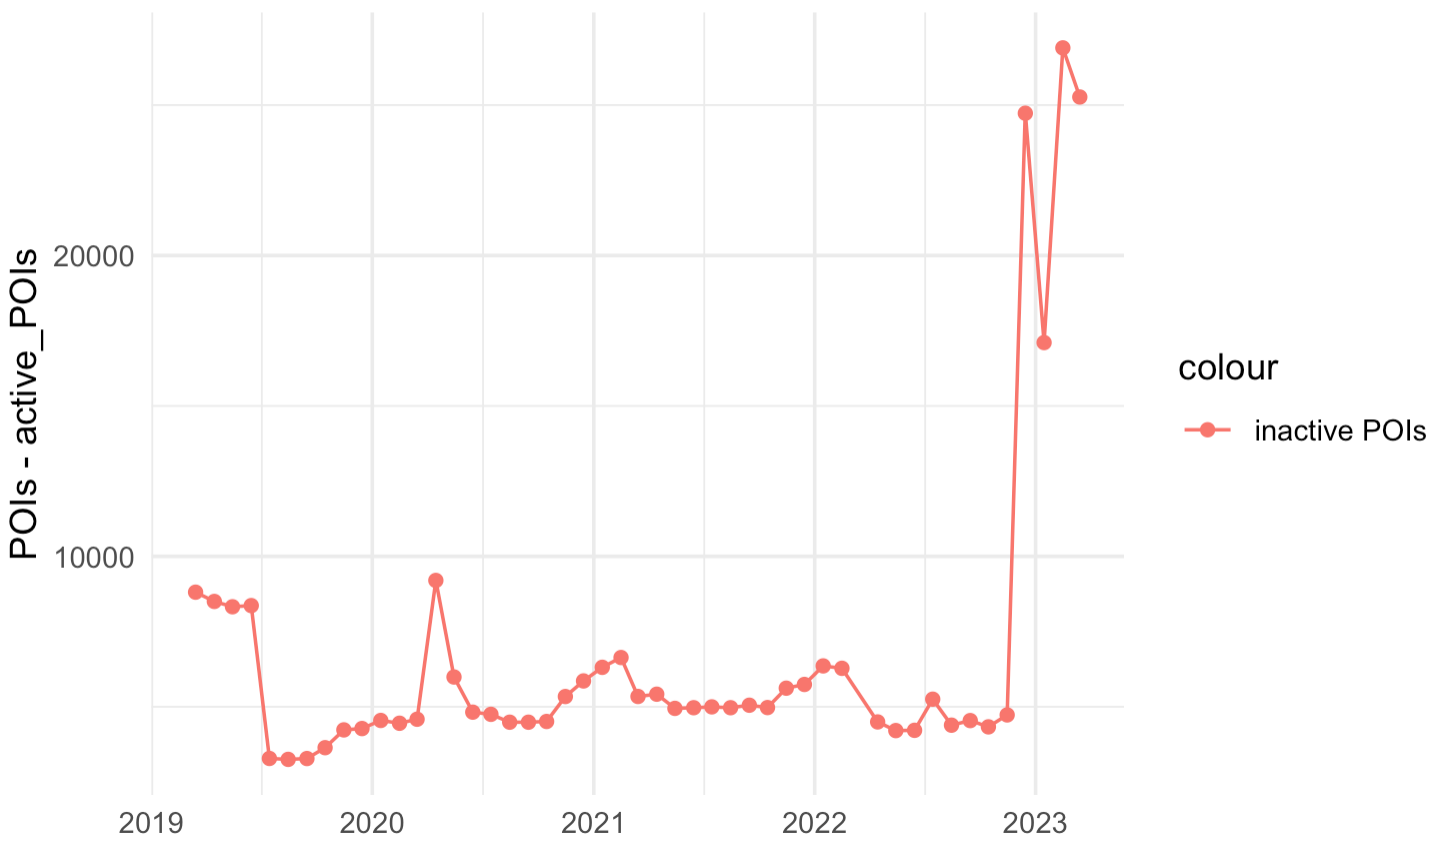
Also, here in figure 1 I plot a new version of the monthly patterns using restaurants and dining POIs only including all new parts you uploaded ast week (in total 499 files per month). It seems that the level of activities starting 2023 is still problematic. And this issue is associated with a significant increase in inactive POIs (zero or NA visits) starting 2023 (figure 2). Could you please help check again if there is something going wrong, or I probably missed something?
@Binzhe_Wang_MIT can you provide more clarity on how you created the aggregations in fig 1? Are you looking at these 2 NAICS across all locations?
Regarding fig. 2. Are you seeing a corresponding drop on locations that previously had visits that no longer have visits? If not it may be that many of the POI added in 2023 just don’t have visit data (just core Places data) and can effectively be ignored for these purposes.
Hi Evan, thanks a lot for your help. For Figure 1, (1) I select POIs whose top_category is “restaurants or other eating places”, and
(2) exclude POIs not in the contiguous US; and (3) sum monthly normalized_visits_by_state_scaling of all those POIs selected.
I will take a closer look at those POIs in figure 2. Thanks again for your help!
@evan-barry-dewey Hi Evan. Did you get a chance to take a look at the aggregated foot traffic data? Also, are there any updated normalization files (now it is still the May-07 version)?
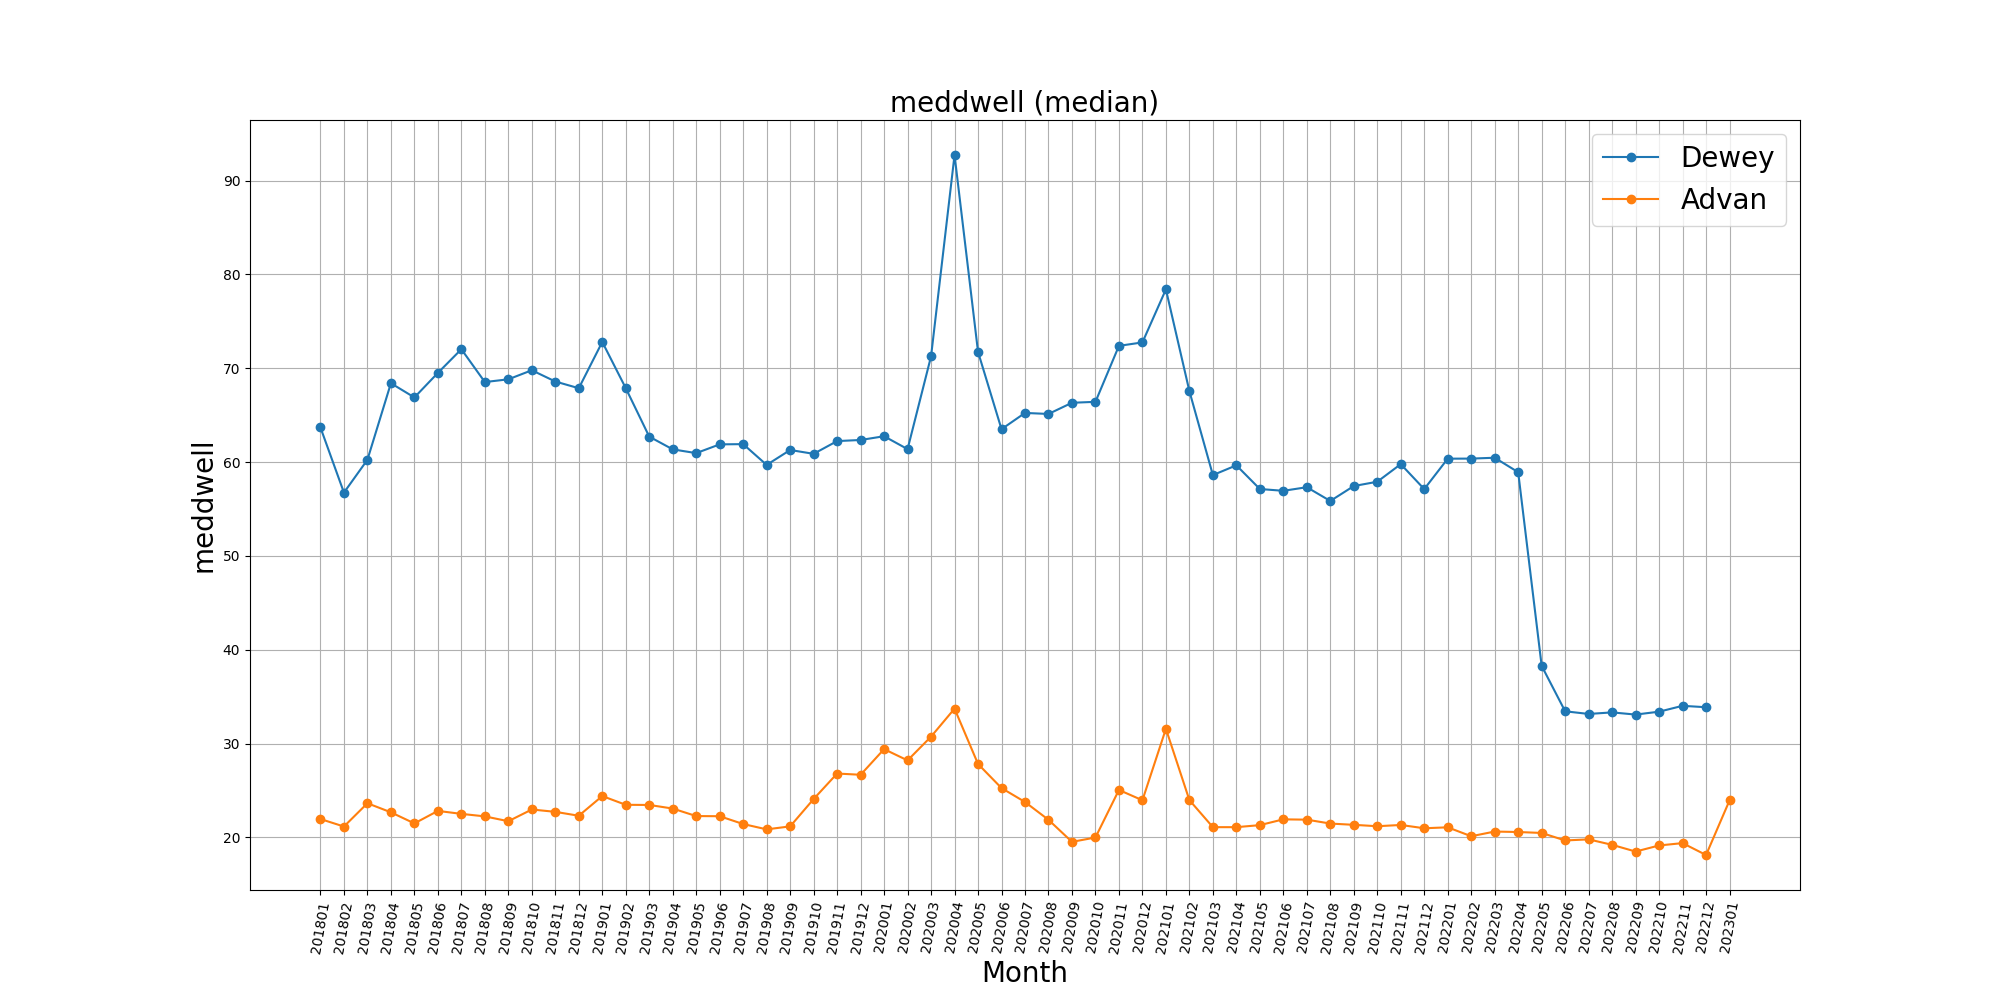
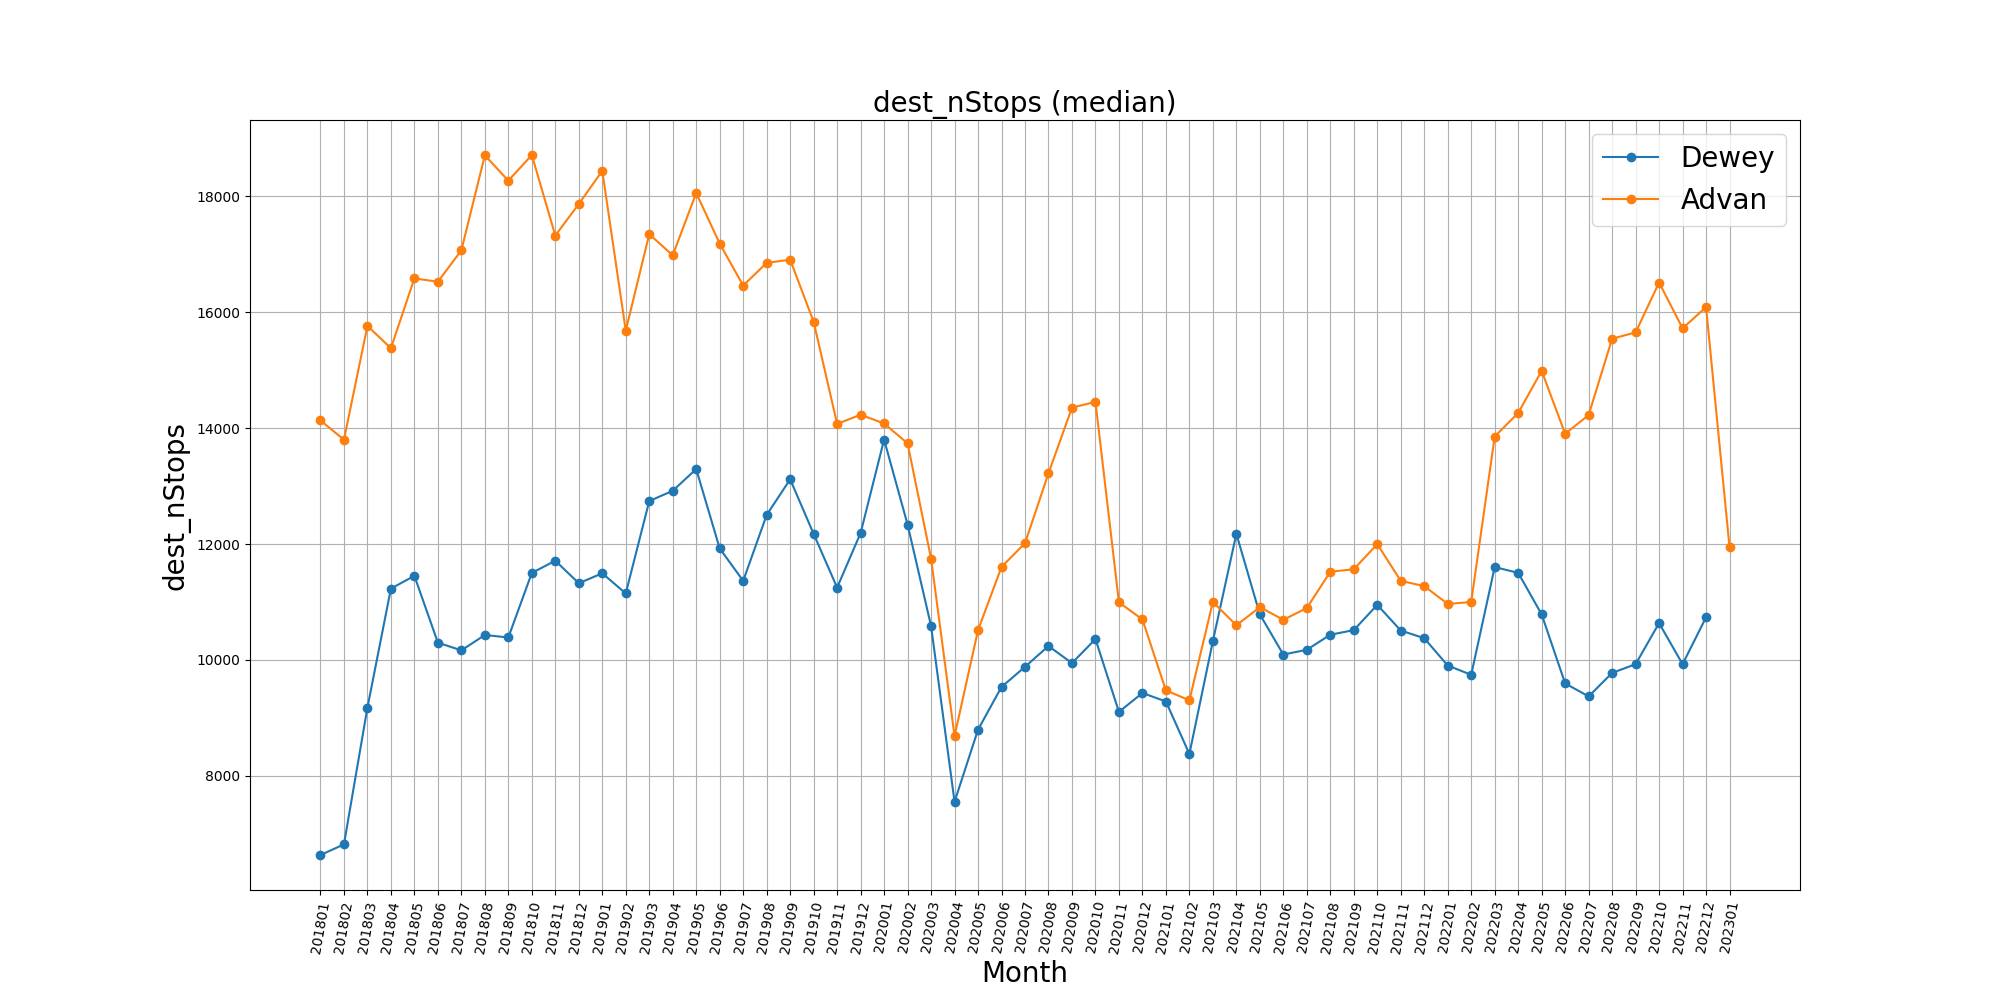
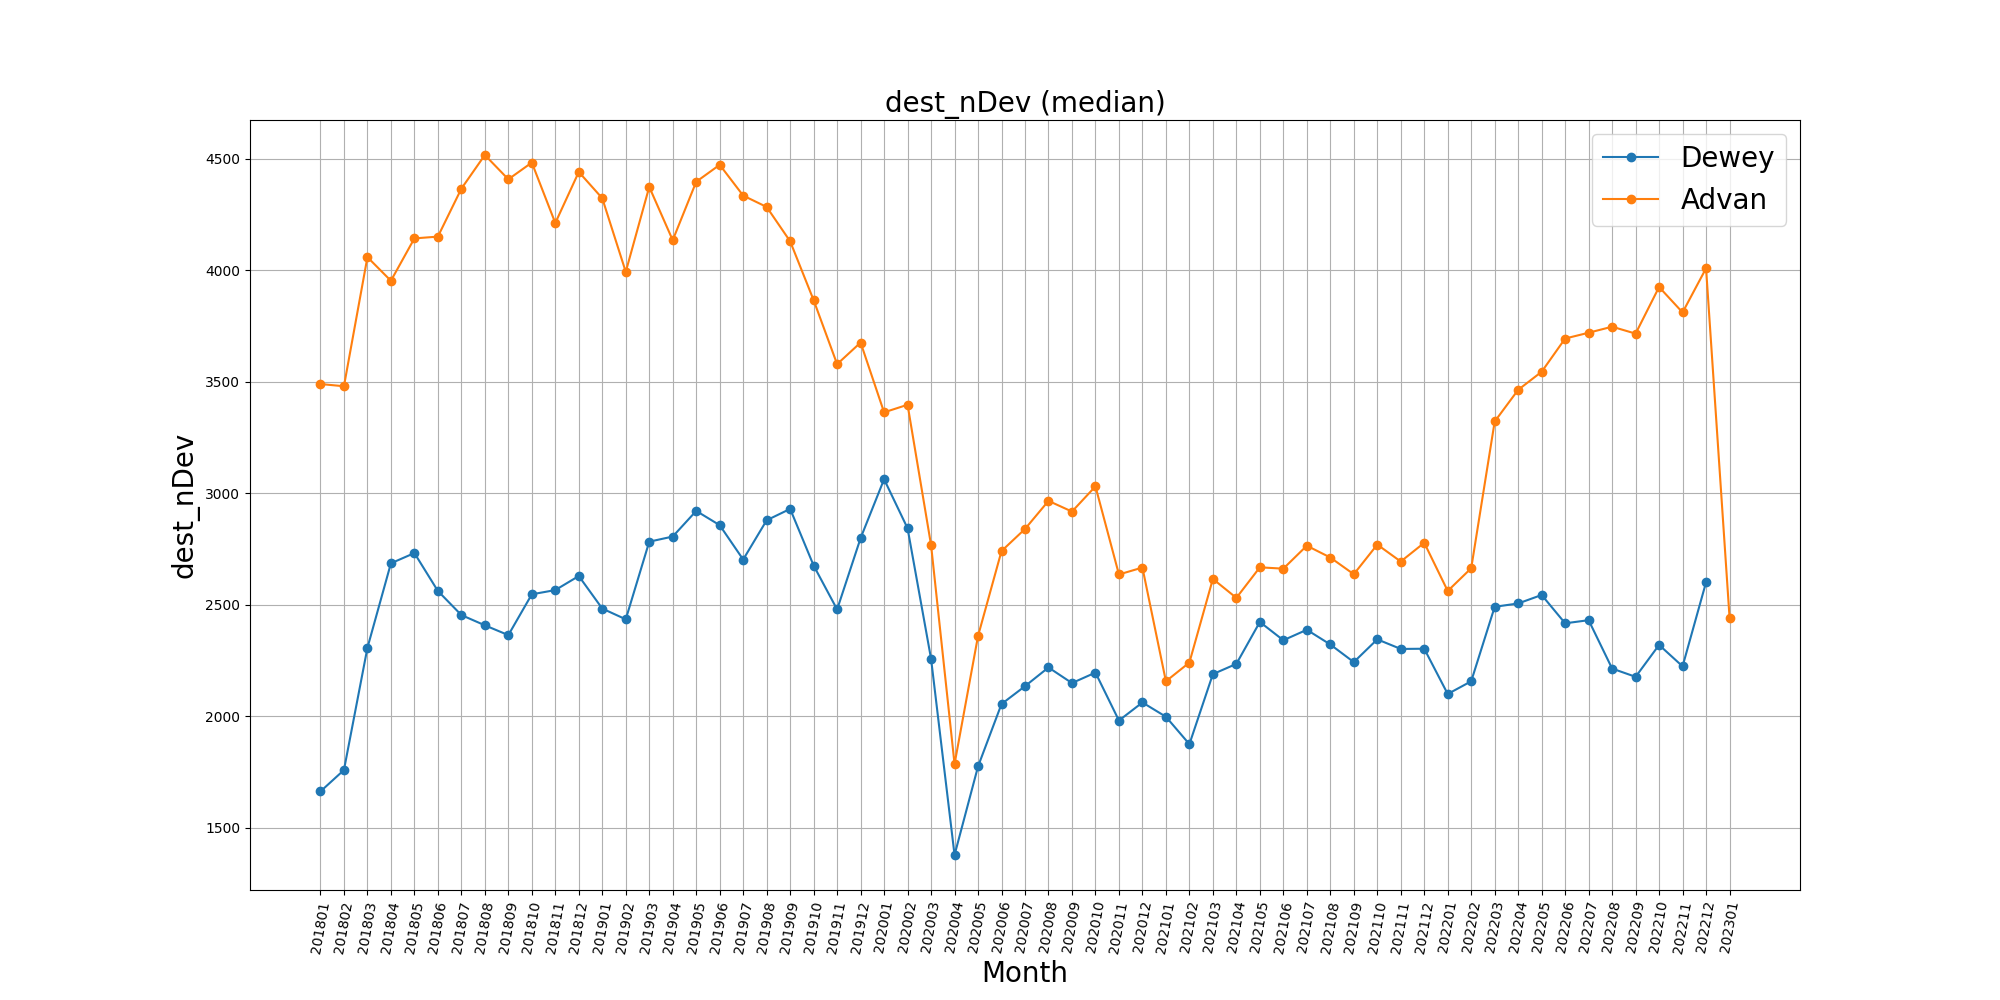
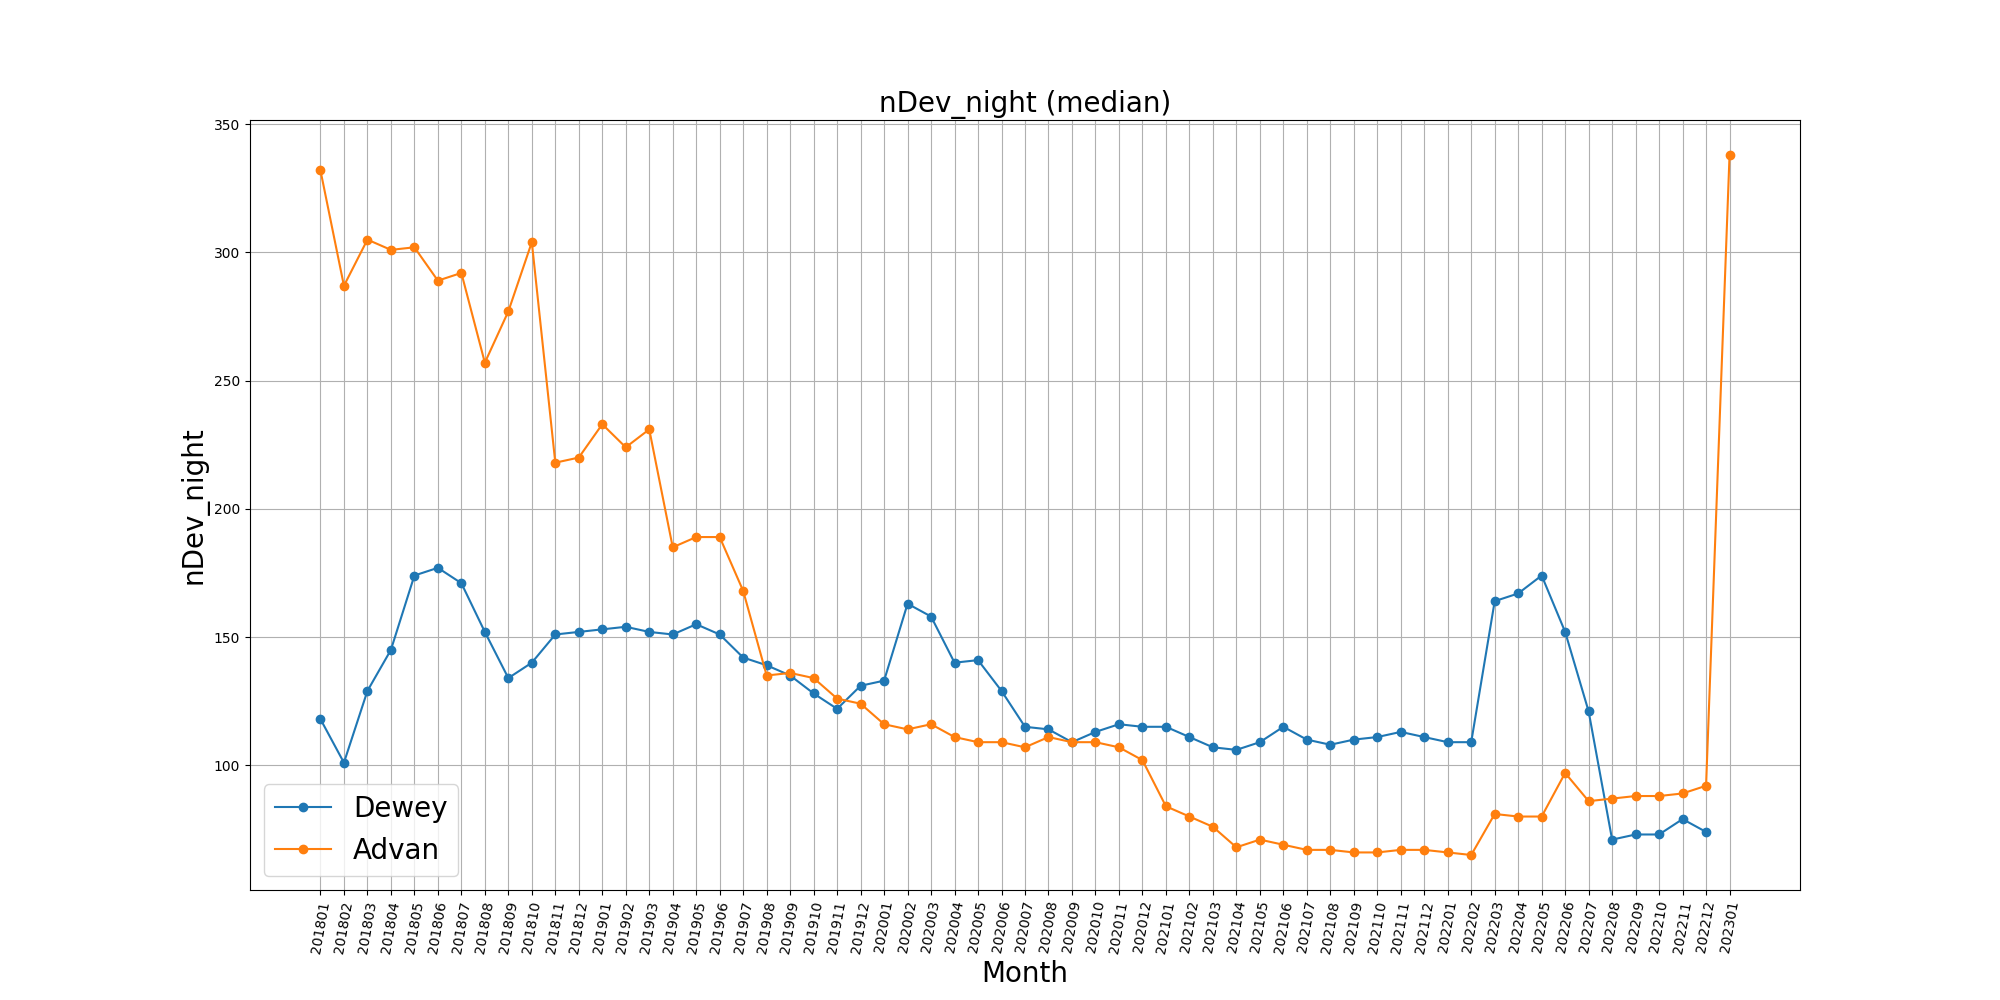
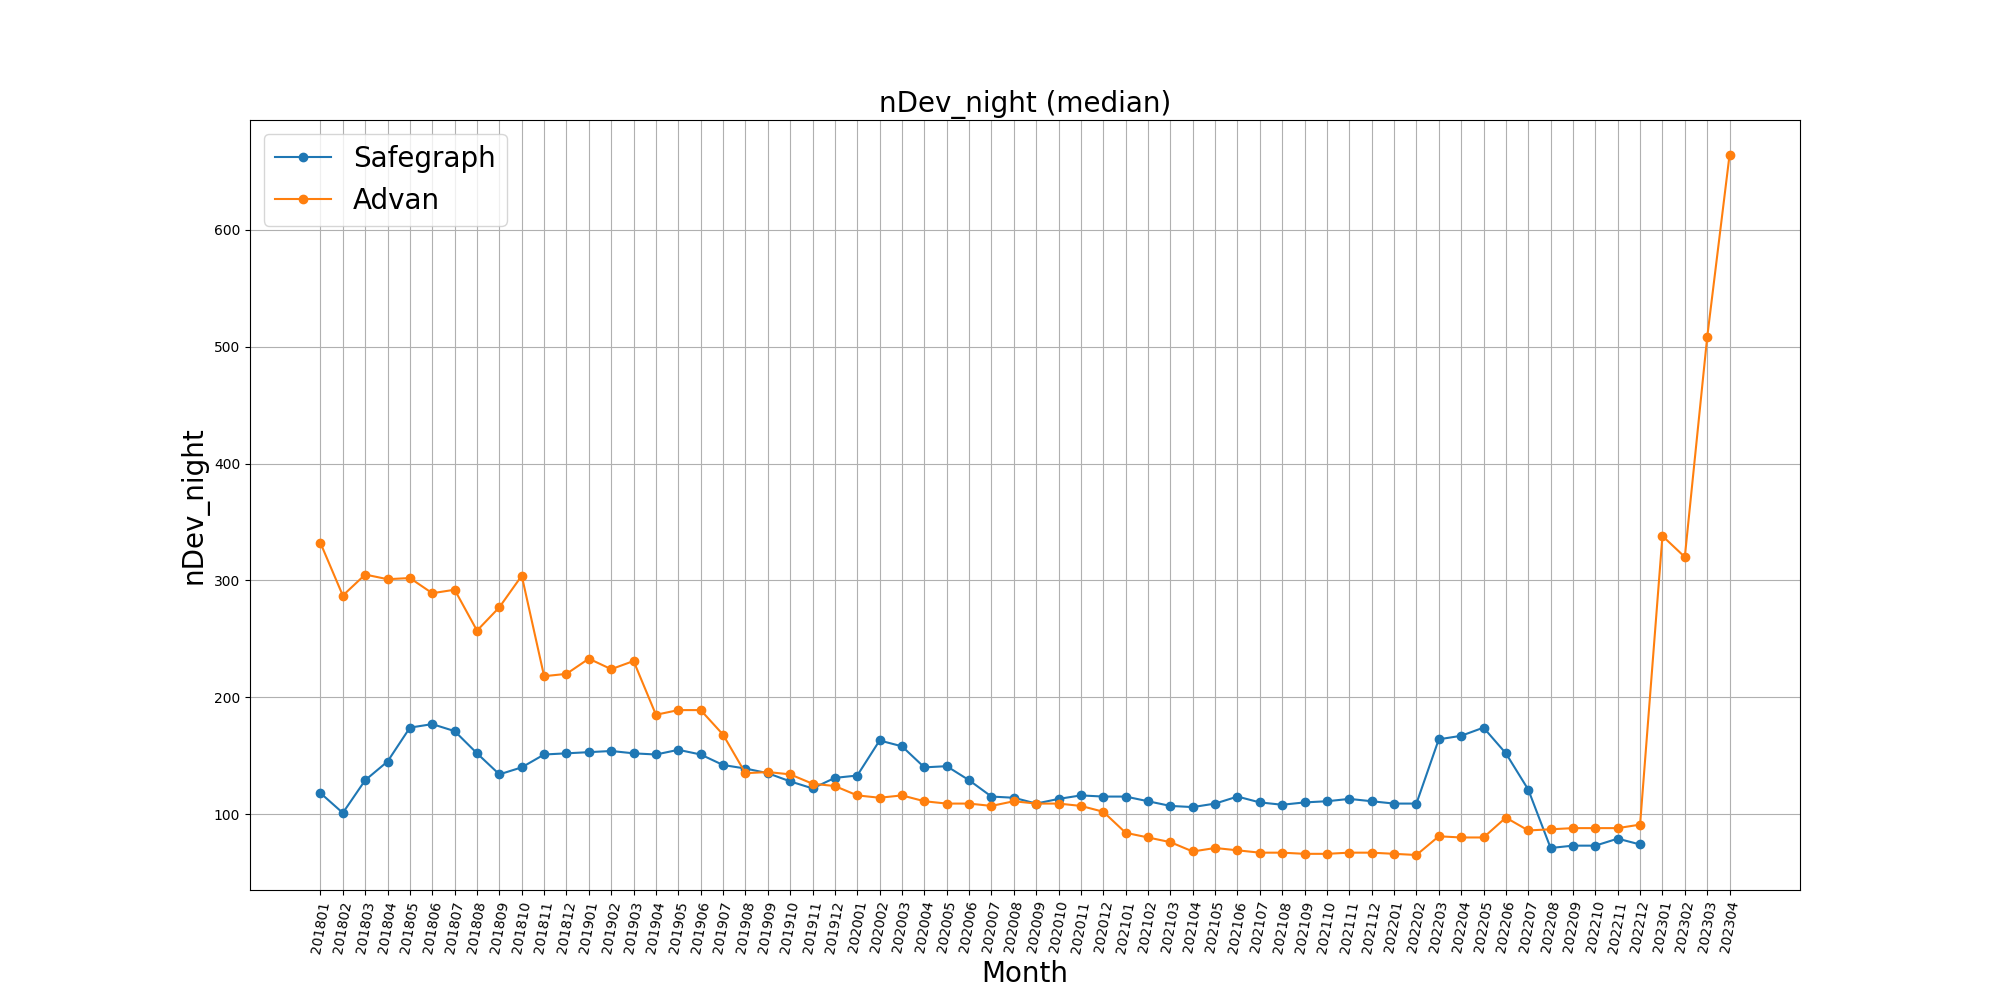
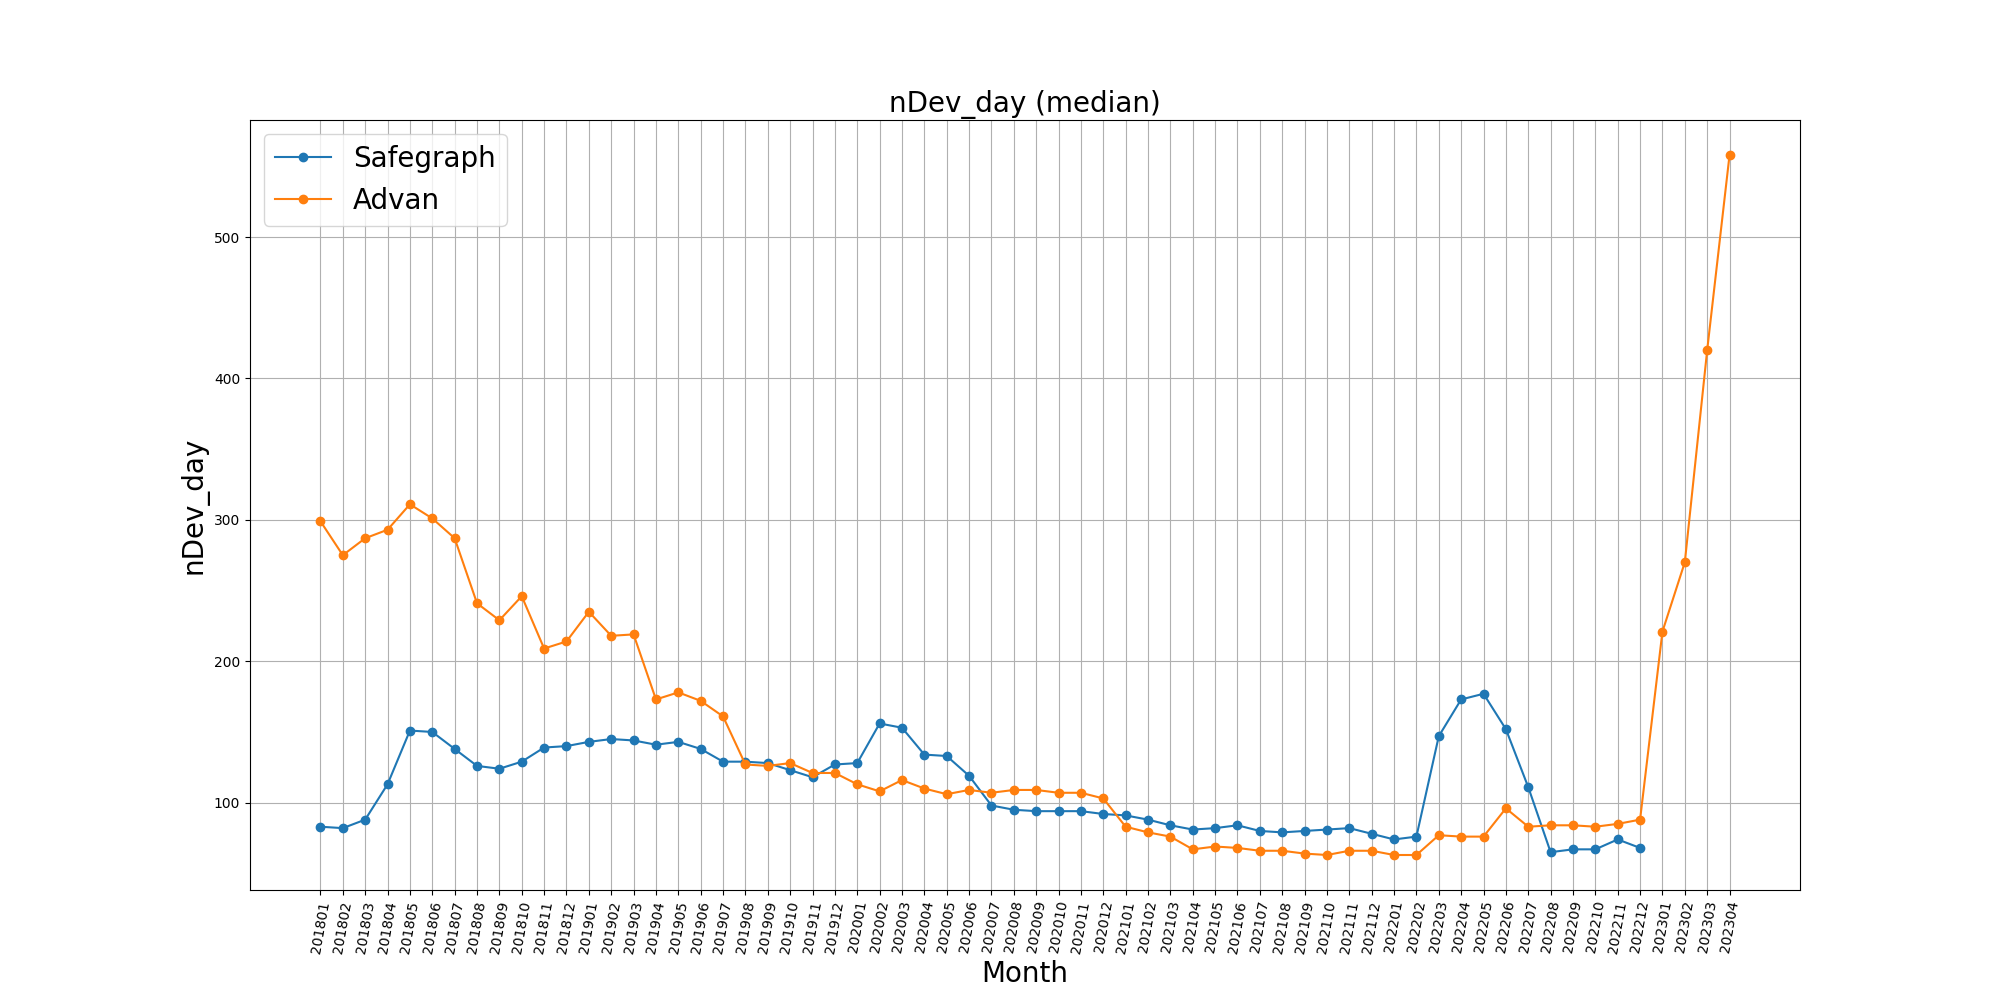
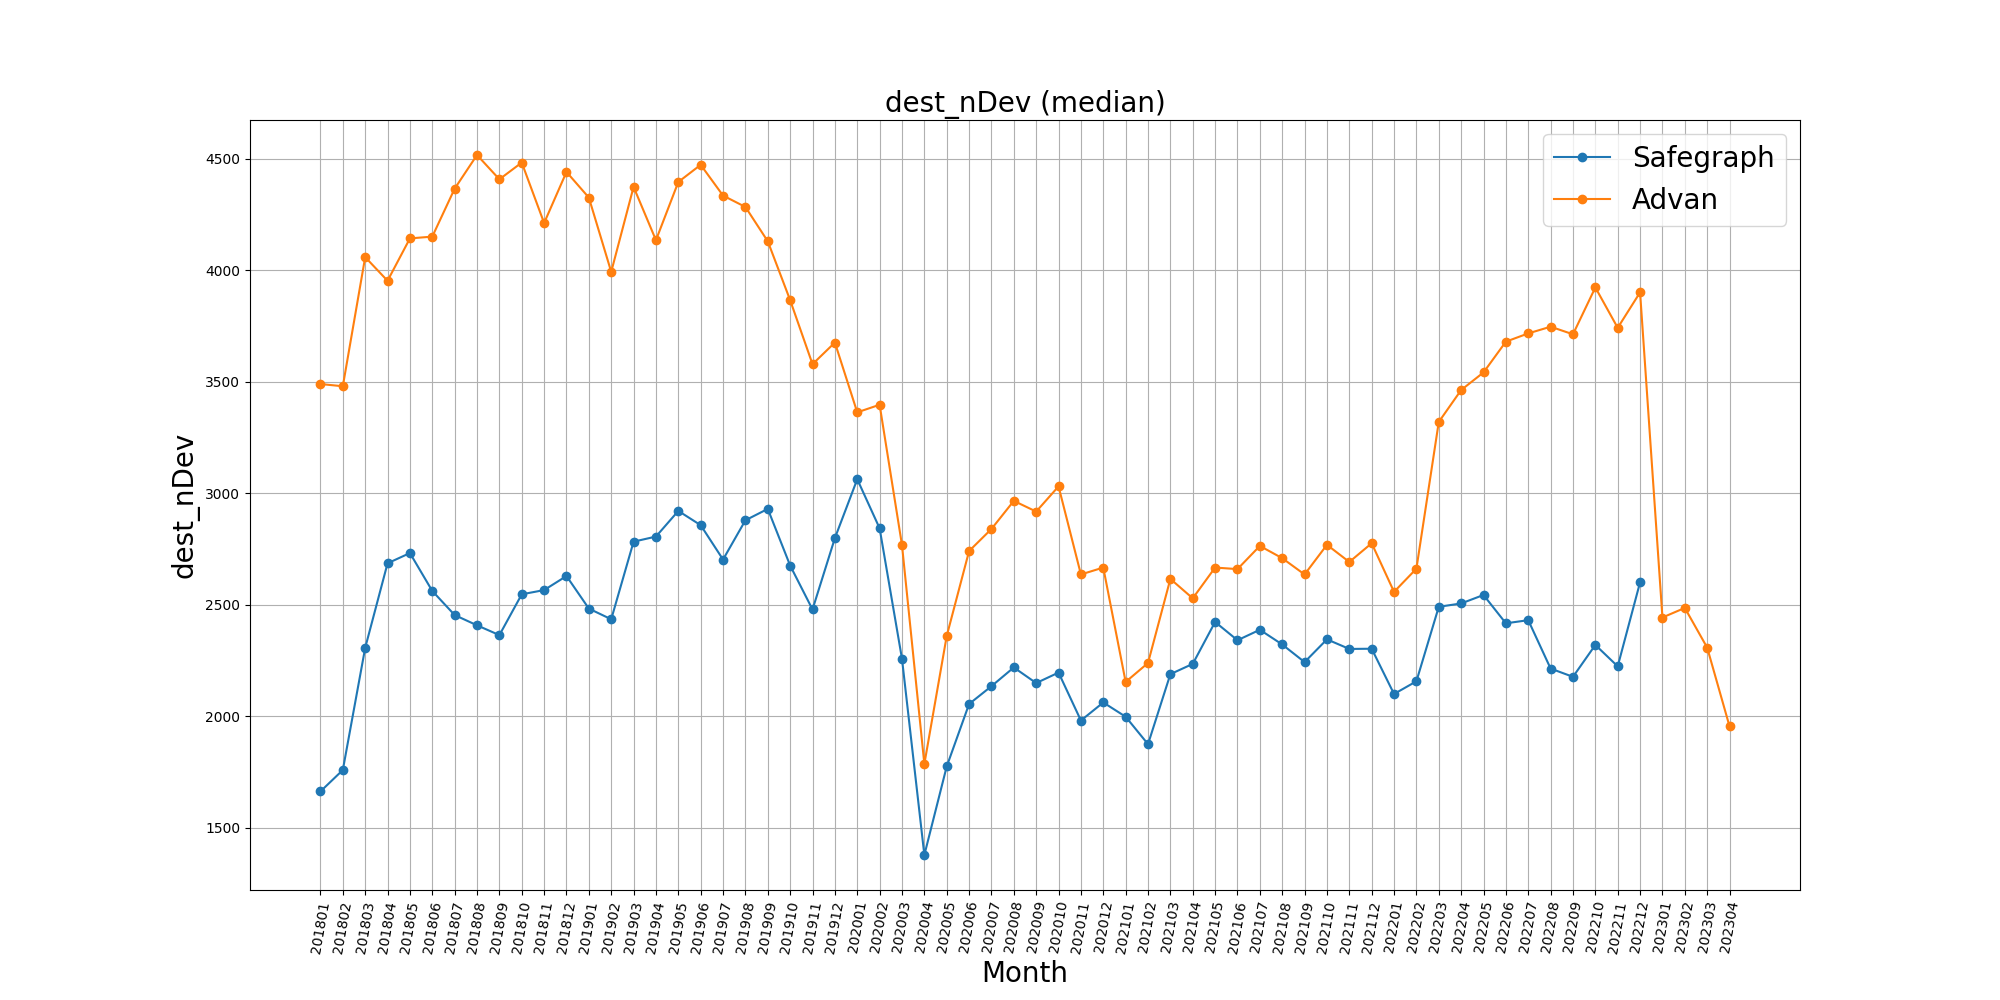
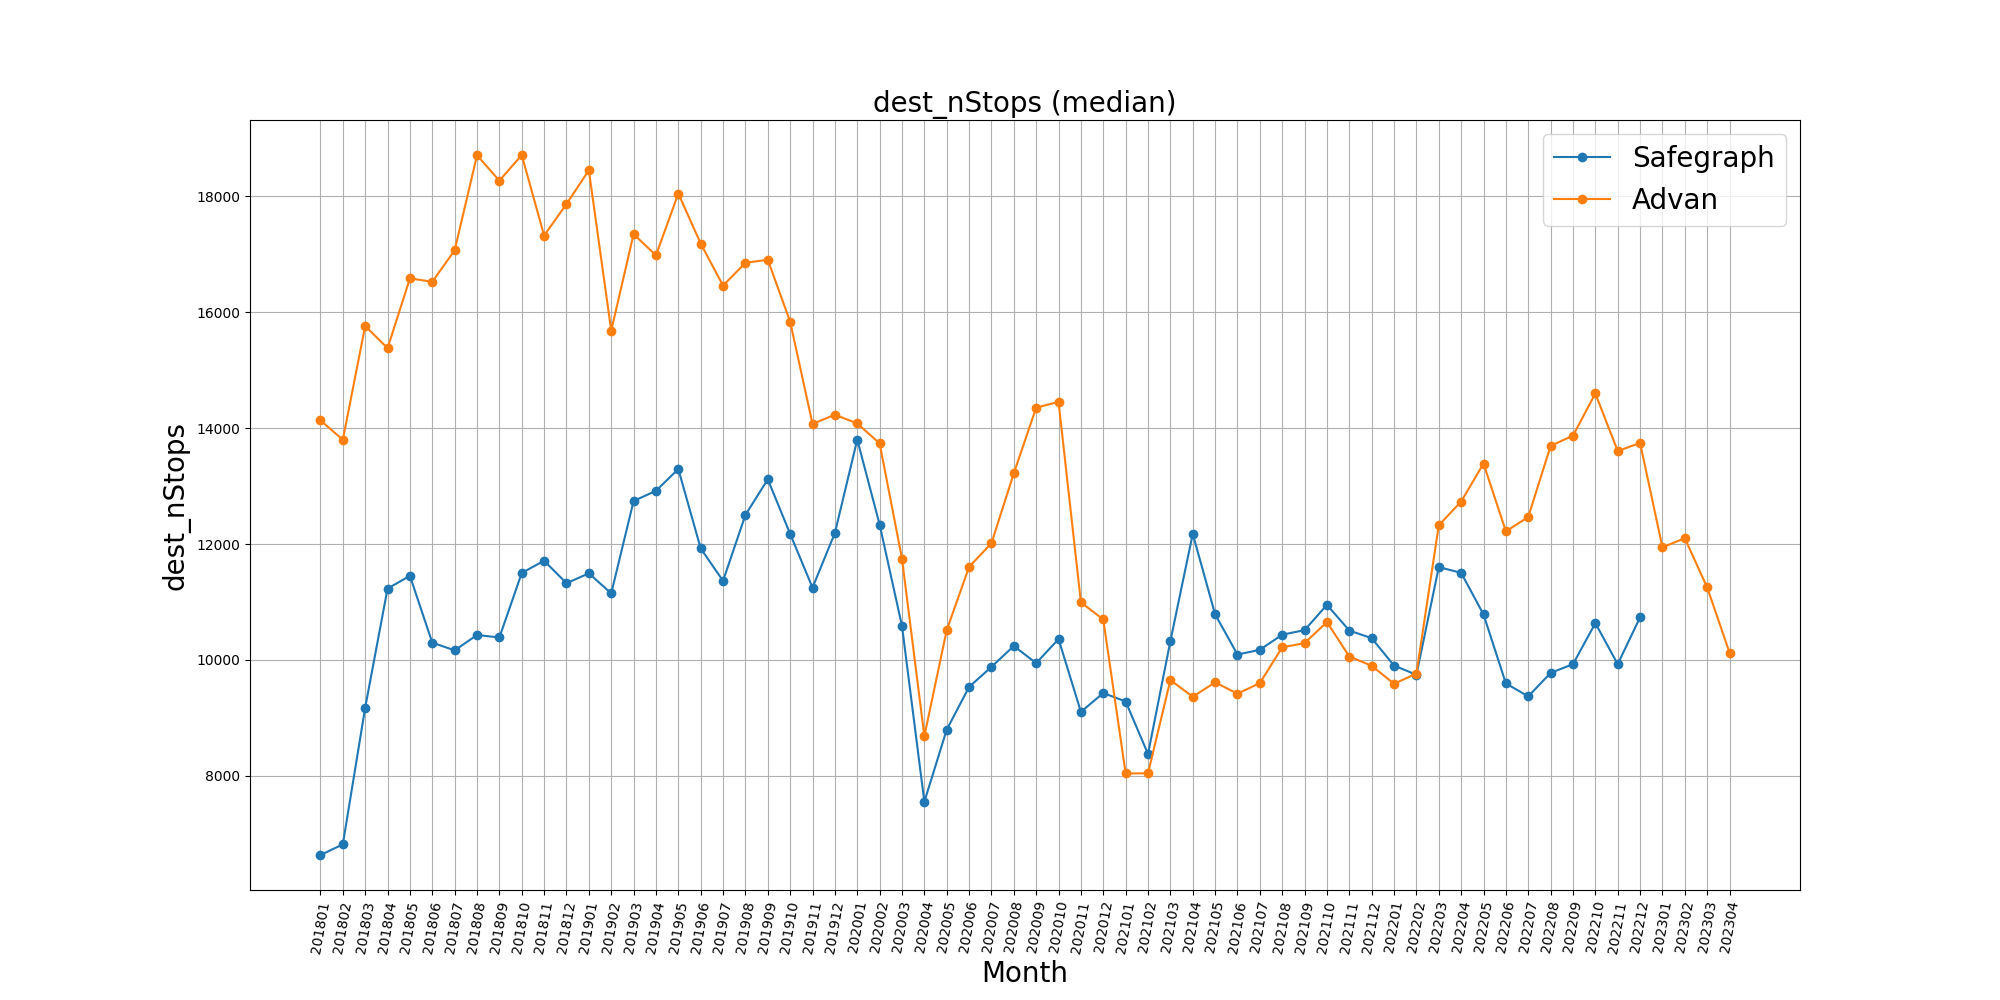
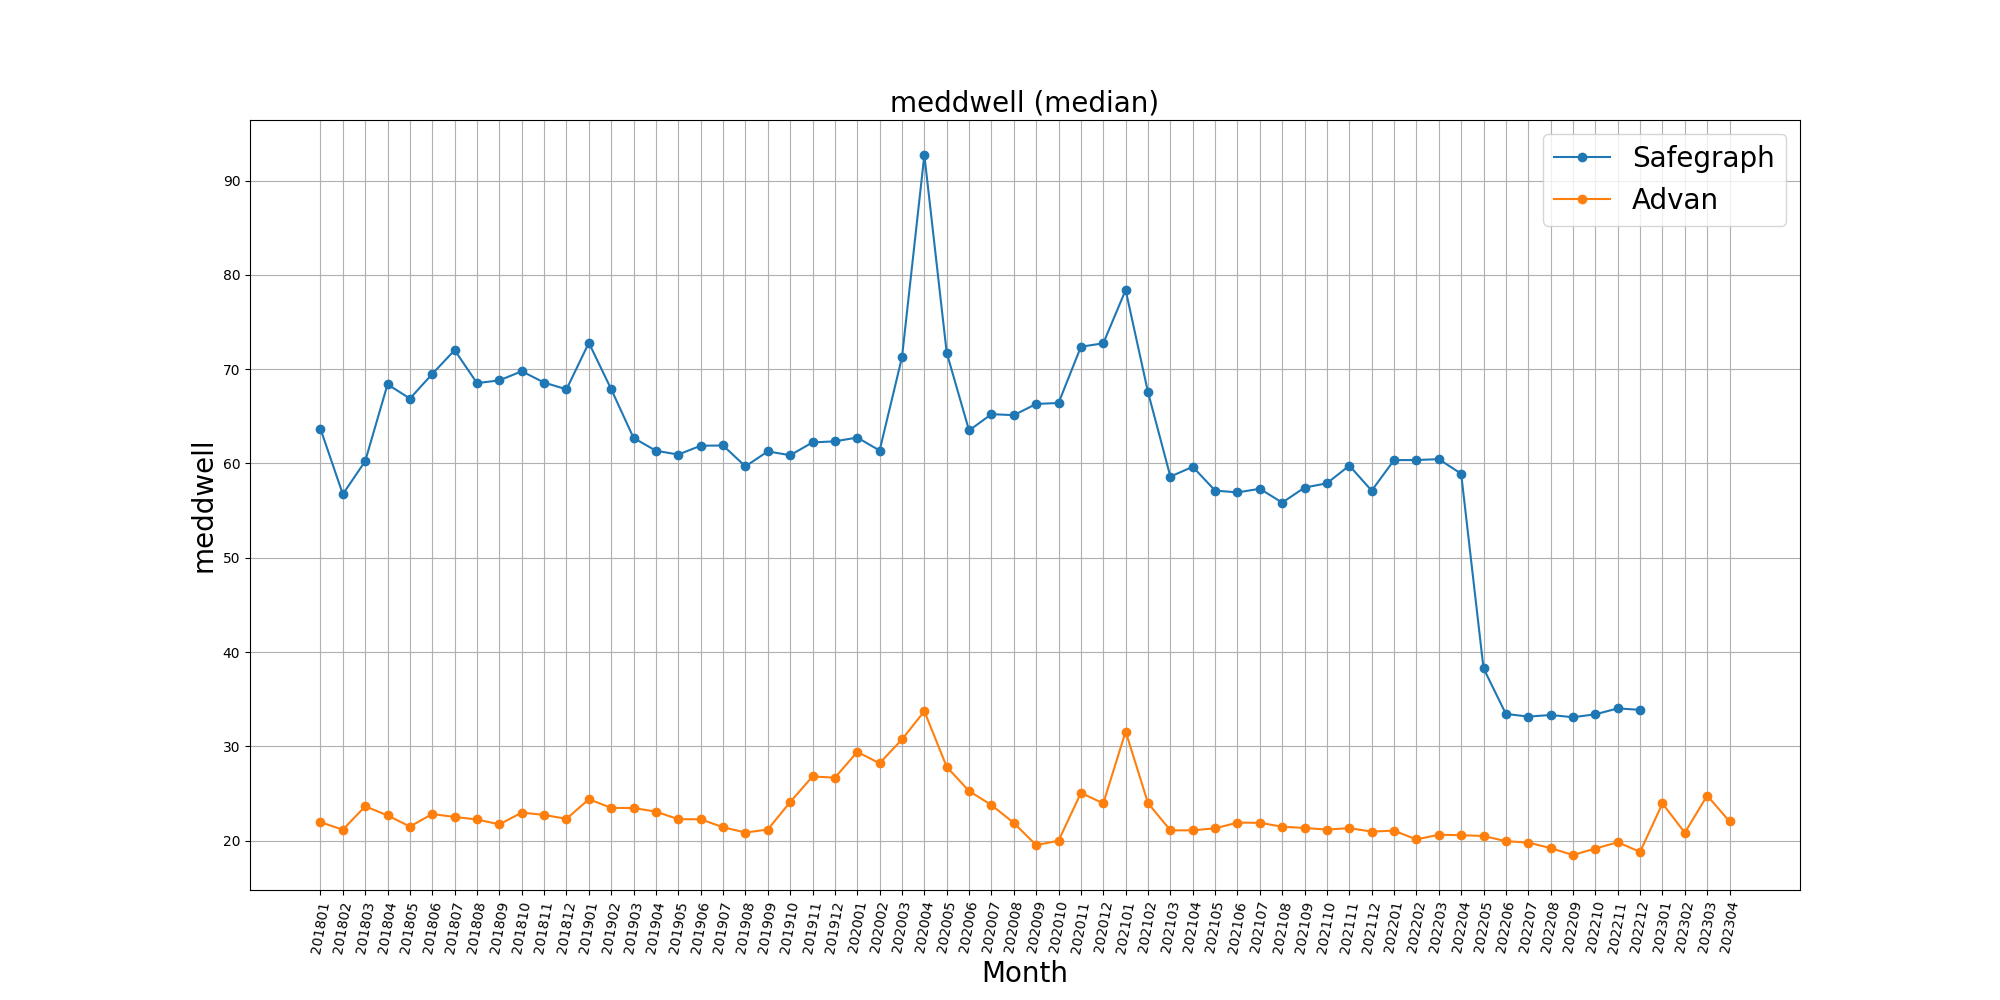
I also found that the neighborhood pattern and weekly pattern from Advan have abnormal drops and hikes. The figures below showed the medians of median_dwell(meddwell), raw_stop_counts(dest_nStops), raw_device_counts(dest_nDev), number_devices_residing(nDev_night) and number_devices_primary_daytime(nDev_day).
particularly, comparing to Dewey data it is much significant to see the drops for dest_nStops and dest_nDev, also the hikes for nDev_night and nDev_day.
Could you explained what conducts to such huge changes in the begining of 2023. Also when you estimated the data later than Jan 2023 will be released from Advan?
The methodology and panel of these datasets are different and will continue to diverge over time so we’d encourage you not to try and compare them over time across attributes.
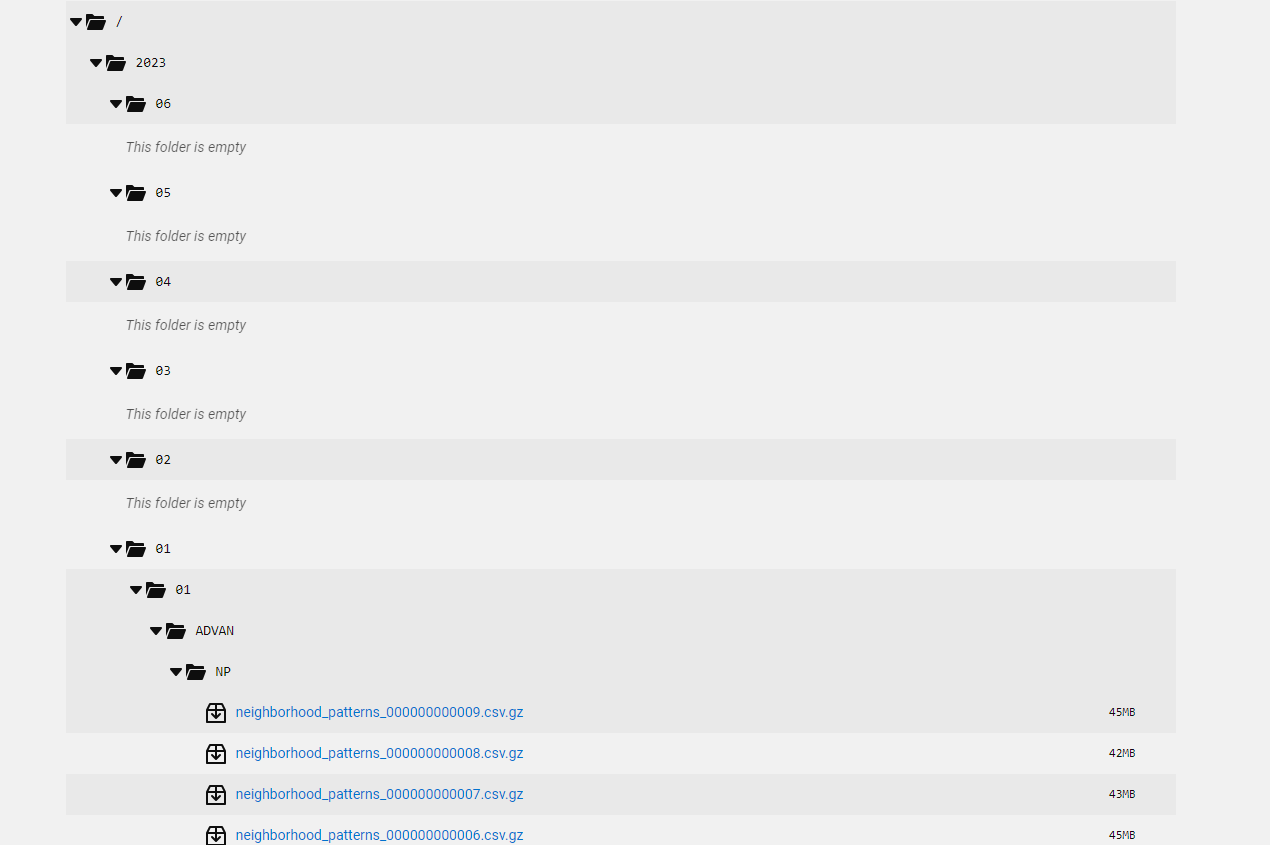
Advan 2023 data is available on the platform, although I believe we still need and updated summary files for NP.
Thank you Evan! We are indeed analyzing the trend over month. I will try to filter out the Shared Polygons.
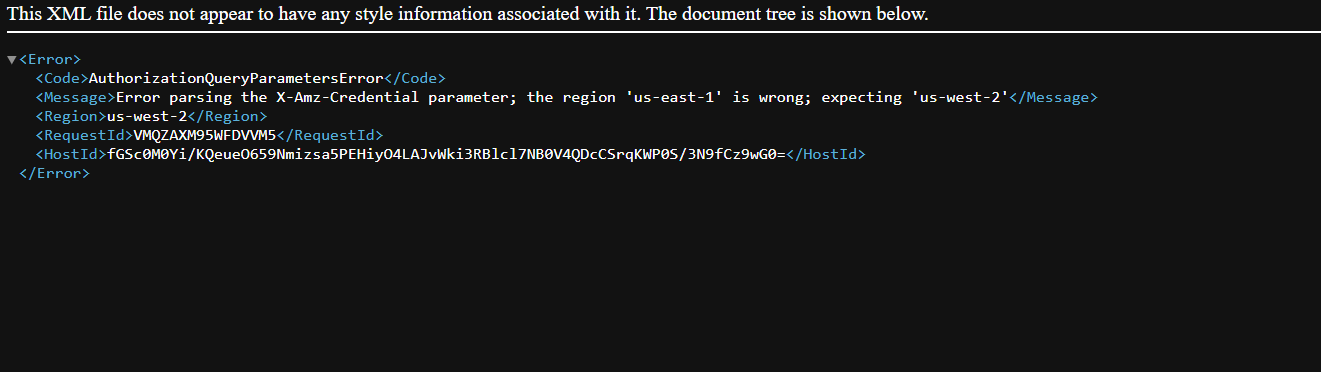
In my account under https://marketplace.deweydata.io/#/files. I only have data of Jan for year 2023 while the folders under Feb - Jun are empty. Is that normal or I missed something?
Now The link for panels work! Thank you for helping! But the hikes for nDev_night (number_devices_residing) and nDev_day (number_devices_primary_daytime) still look crazy. Just wanting to clarify here, I’d like to be sure that the new method of organizing data has been applied to the data since Jan 2023 or all the Advan data?
Advan is working on some updates to their normalization stats files starting in 01/2023 and we’ll soon be restating those files. It should help with the discrepancies starting at that date. Our hope is to get those new files live in the next two weeks.