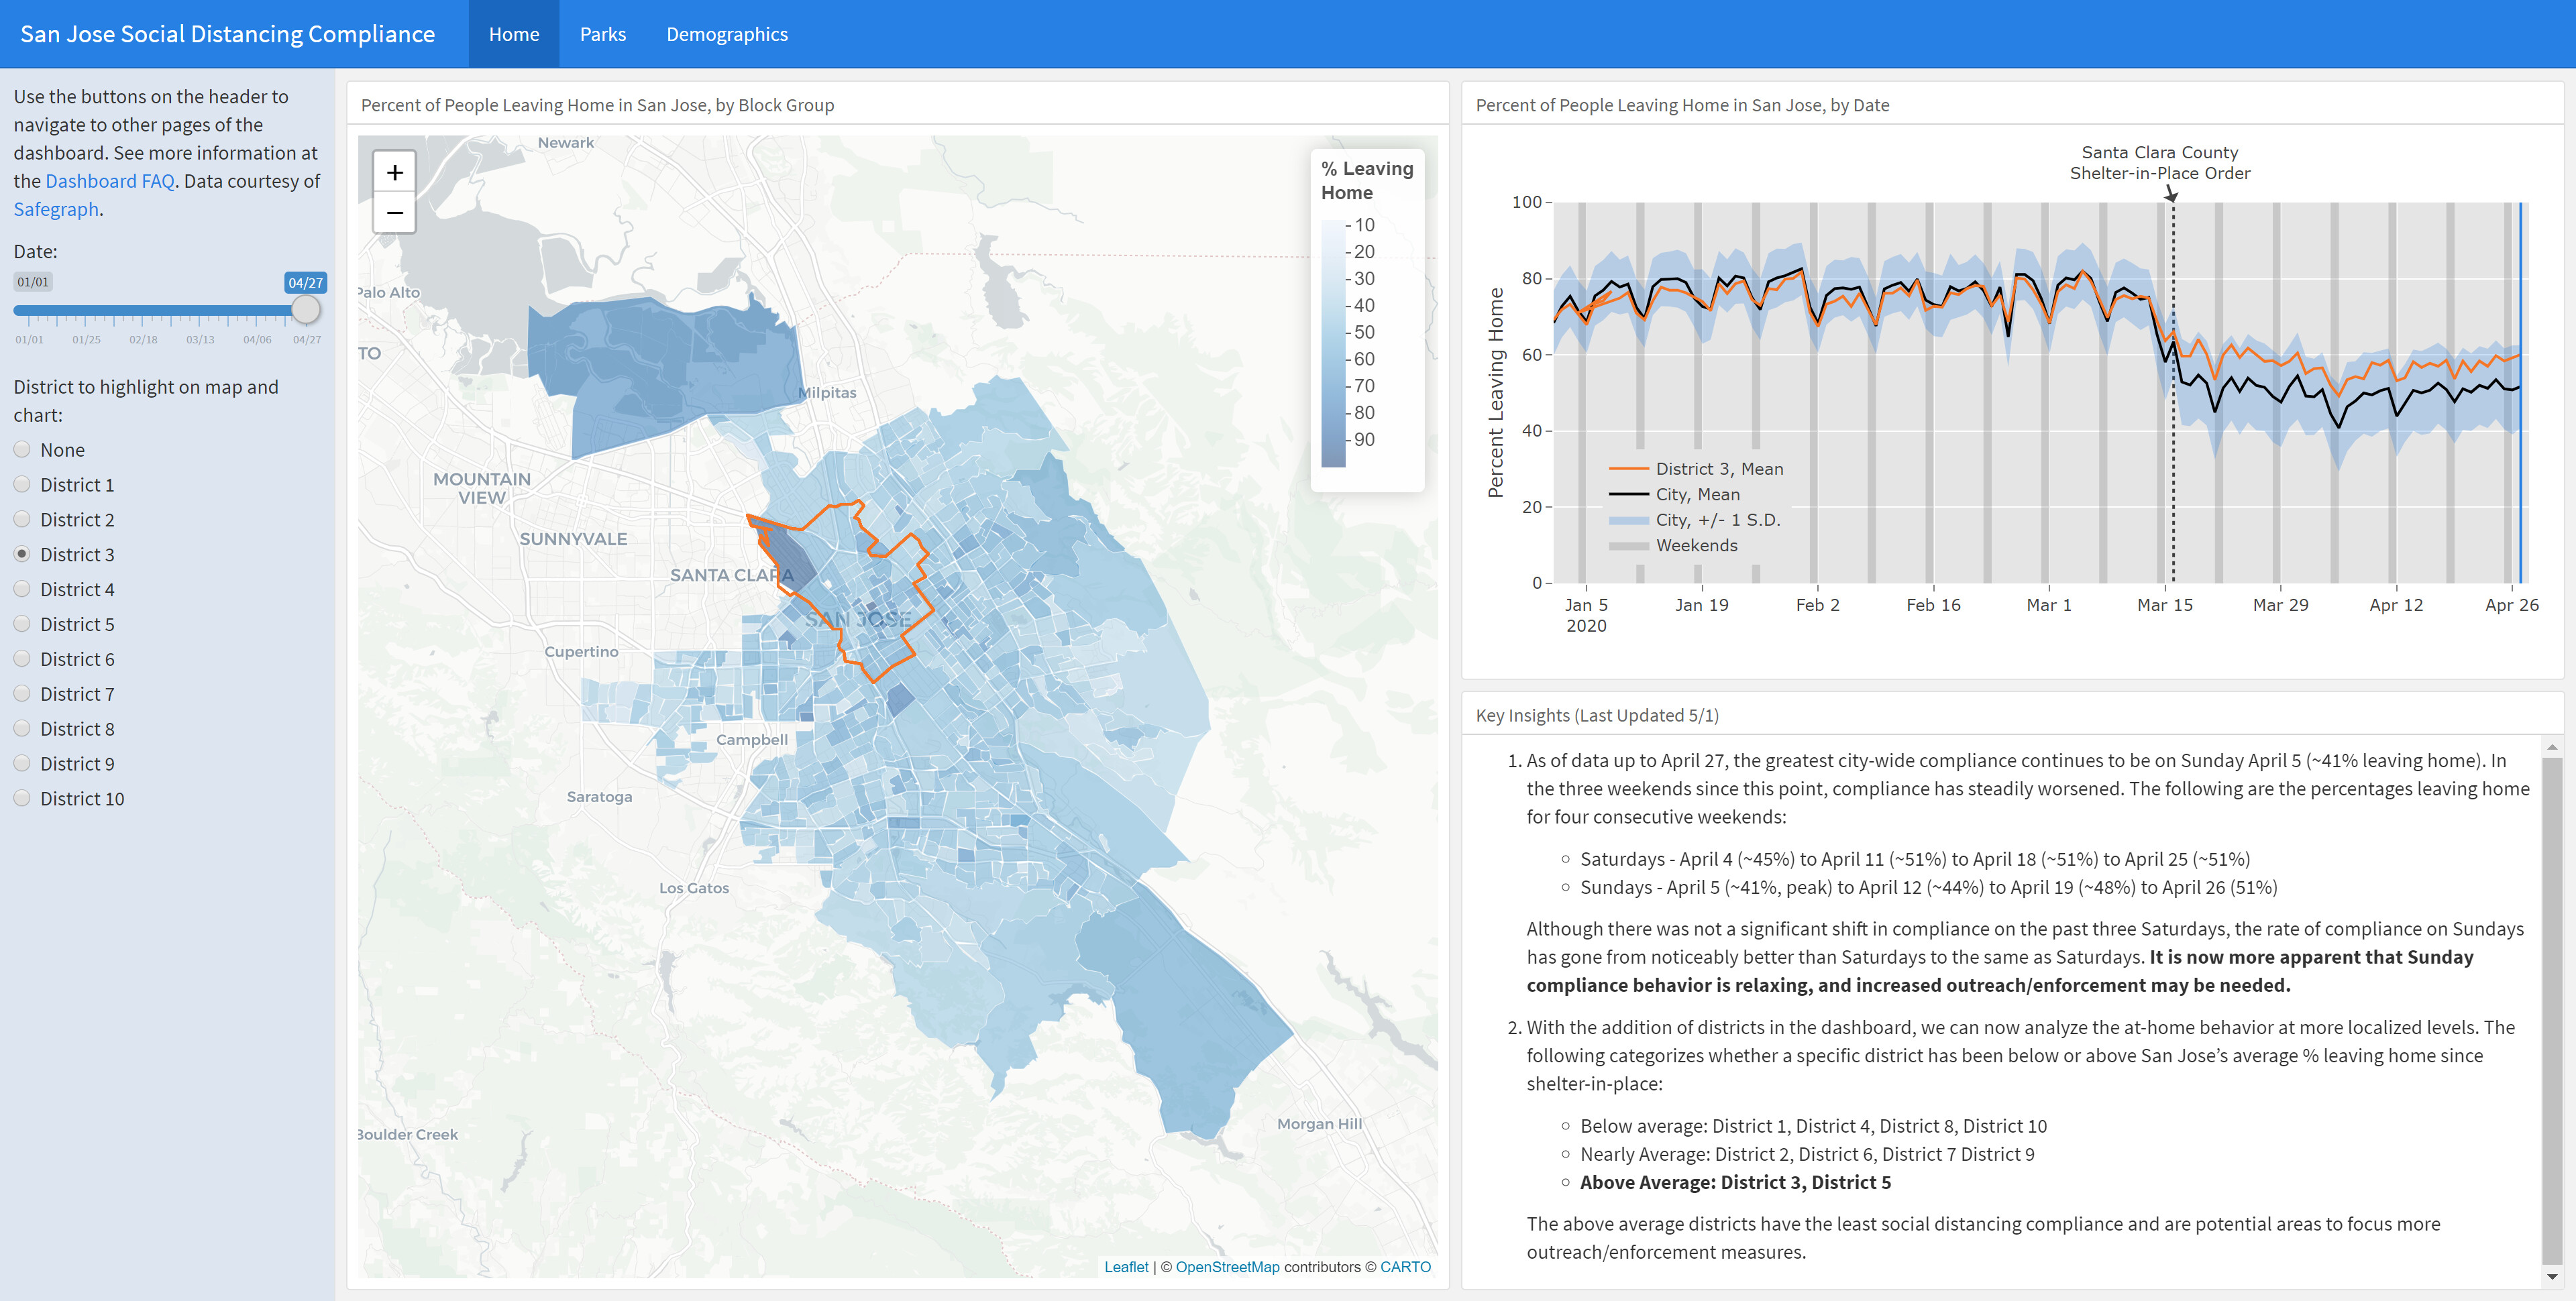
Sharing progress on a compliance dashboard for City of San Jose Emergency Operations Center, produced with students @Julia_Wagenfehr_Stanford @Cameron_Tenner_Stanford @Simone_Speizer_Stanford
https://stanfordfuturebay.shinyapps.io/sanjose/
We’re happy to share backend shiny R code for anyone interested and discuss our techniques. We’d appreciate any feedback to help us make this more useful for local decision-making and academic research.
@Ryan_Fox_Squire_SafeGraph note on the Parks tab, our partners requested the data table be made available with the fields shown. Let us know if this is too much to publish, and we can discuss another solution with them.
Also, @Ryan_Fox_Squire_SafeGraph one of our partners astutely noted that for the SJ airport block group, high % leaving home might be because regular overnight workers have their devices classified as being “home” at the airport, and then they leave when their shift is over. Do you think this is a correct interpretation?
@Derek_Ouyang_Stanford Very nicely done. I would be interested in the shiny code. Github? Thanks
@Jude_Bayham_Colorado_State_U I’ve put on a public repo here. You’ll see a lot of other knitted HTMLs there, with a Github pages navigation view here. As you probably know, the active Rmd needs to sit on our private repo alongside the Safegraph data which we’re not publishing, so this is not as fully documented as we can make it in the future, including some of the processing that goes into the input files, but feel free to explore and we can discuss details. (If I forget to update this public version in the coming weeks and you’re still interested to see the backend, ping me).
@Derek_Ouyang_Stanford re: data exposure: i think it’s OK thanks for checking
re: San Jose airport, it seems like a reasonable hypothesis. You could consider simply omitting the airport CBG
really great work on this @Derek_Ouyang_Stanford and team
@Derek_Ouyang_Stanford Great dashboard! Are the park polygons from the city or from Safe Graph POI geometry?
@Scott_Ogletree_U_of_Edinburgh currently, using polygons directly from the City
@Derek_Ouyang_Stanford are you OK with NAPSG sharing this dashboard to a few other municipalities? https://www.napsgfoundation.org/
Very informative! nicely done. Could you please share more details regarding which specific SafeGraph datasets you used for this?
@Vikas_Parkland_Center_for_Clinical_Innovation 1st and third tabs, anywhere there’s “% leaving home”, we’re just using the social distancing dataset. for the parks tab, we’re using weekly patterns.
This is fantastic @Derek_Ouyang_Stanford – do you calculate the park visit scaling factor using visitor home CBGs?
@Jonathan_Jay_BUSPH yes, we have our own normalization approach that makes use of the knowledge of visitor home CBGs that is described at https://stanfordfuturebay.github.io/safegraph_patterns_normalization.html. Apologies this doesn’t have as much commentary/explanation as it should, as we intend to formalize this at some point, but if you scroll to the bottom you can see the approach we ended up with. There are references to “unrecorded origins of <5 visitors” but with the V2 data this will automatically account for the change to “< 2 visitors”. Happy to discuss in more detail.
Love this, thanks @Derek_Ouyang_Stanford – very clear!