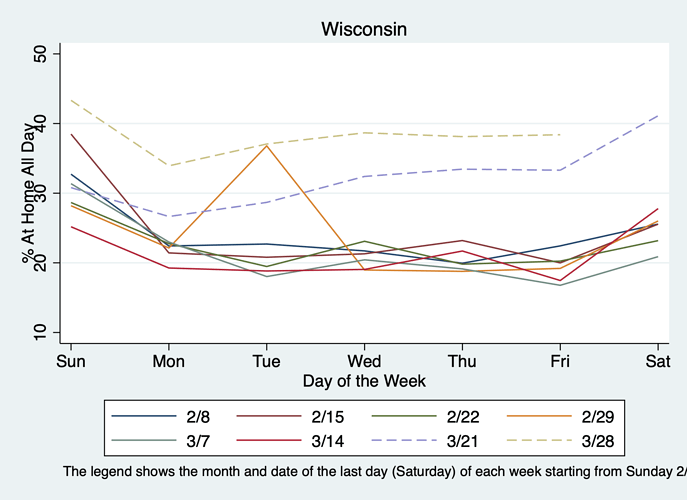
@Ryan_Fox_Squire_SafeGraph Reposting here in case it helps: I did it at the state level by dividing the sum of completely_home_device_count by the sum of device_count. Following is the result for Wisconsin (2/25 is the spike on the orange line). Same spike appears in many other states.
