Hello dear SafeGraph community,
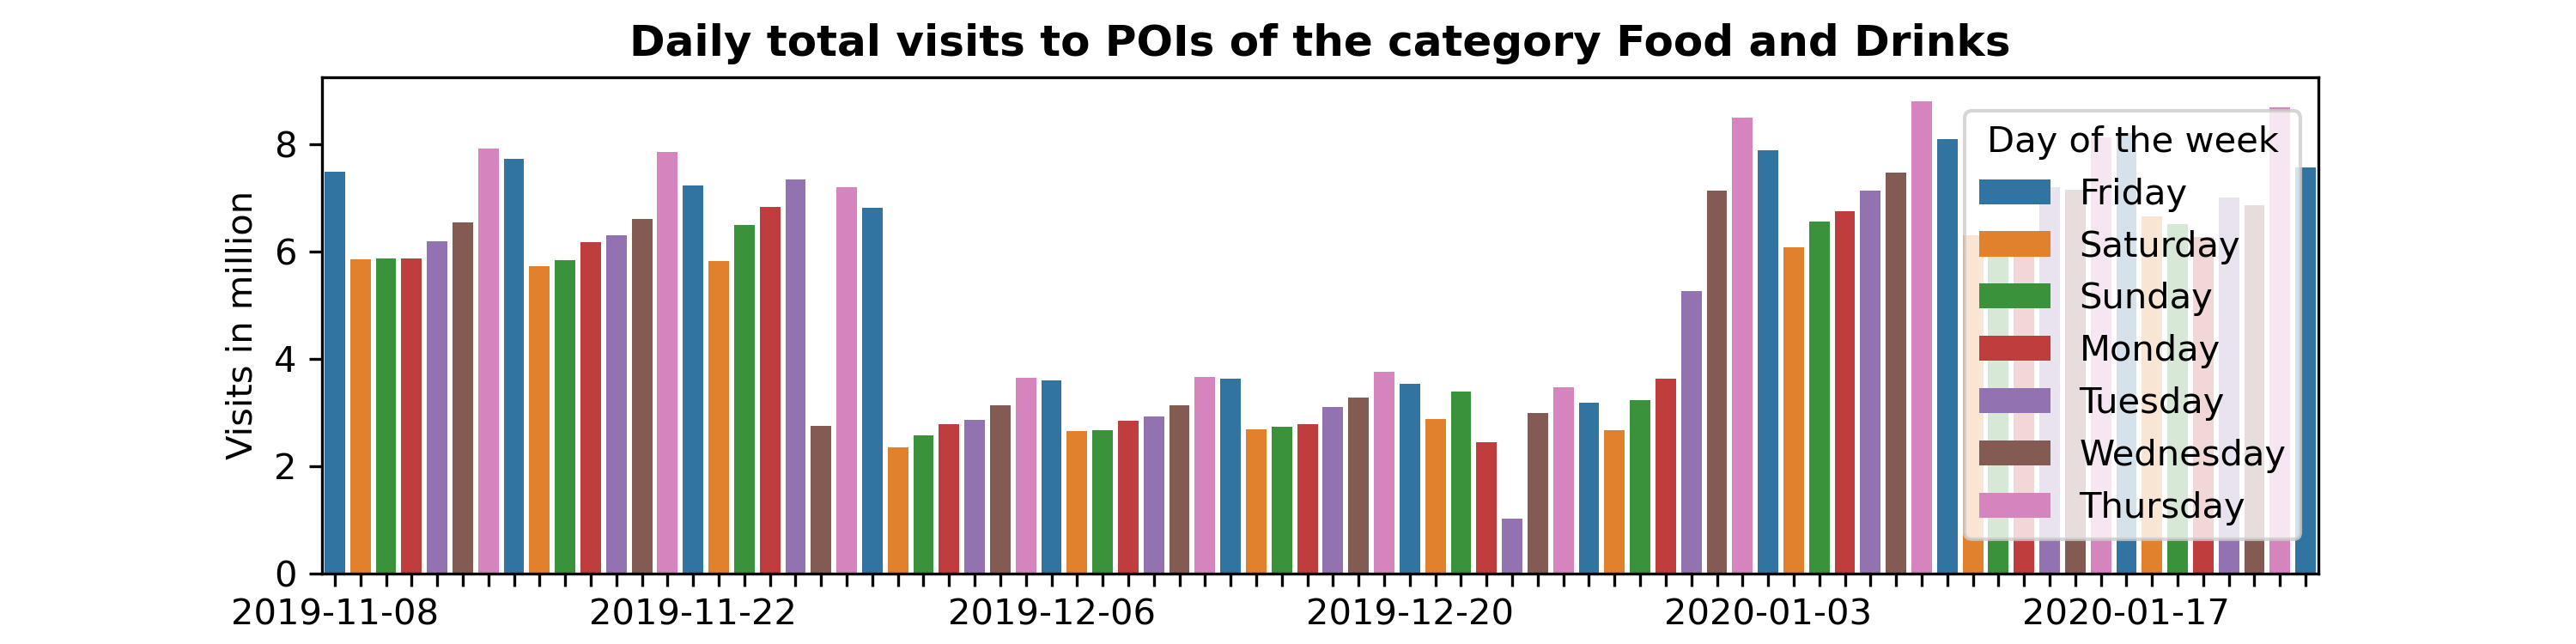
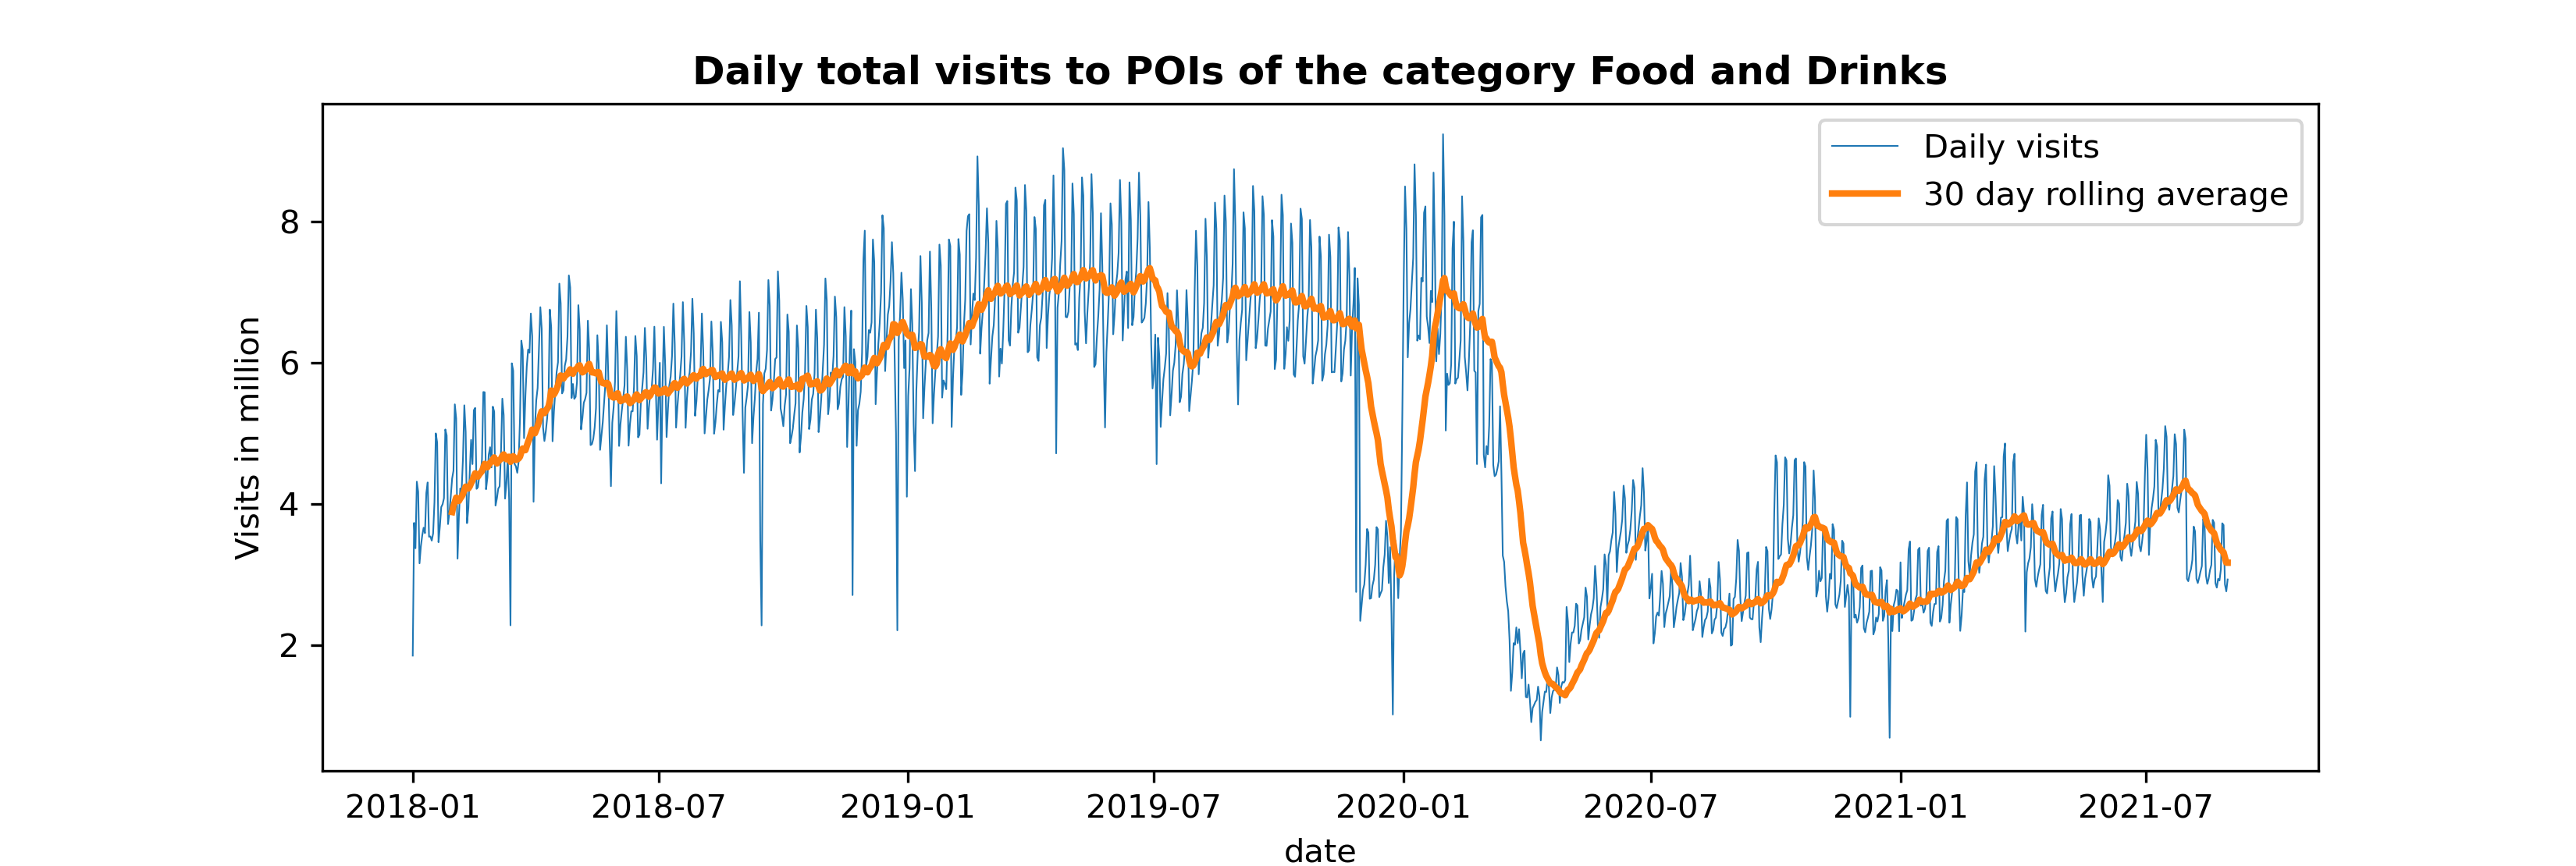
I found that the number of total daily visits (US) drops drastically for several business types, e.g. Restaurants and other Eating Places (NAICS Code 7225) as can be seen in the two plots below. That the number of visits drops after March 2020 is clear (due to the Covid pandemic), but why for the whole month of December 2019? Has there been some data adjustments or so? I have checked the release notes of that month, but didn’t find any hint; the number of devices seen stays stable over the whole time period.
I would greatly appreciate any hint about this issue !
Best,
Luisa