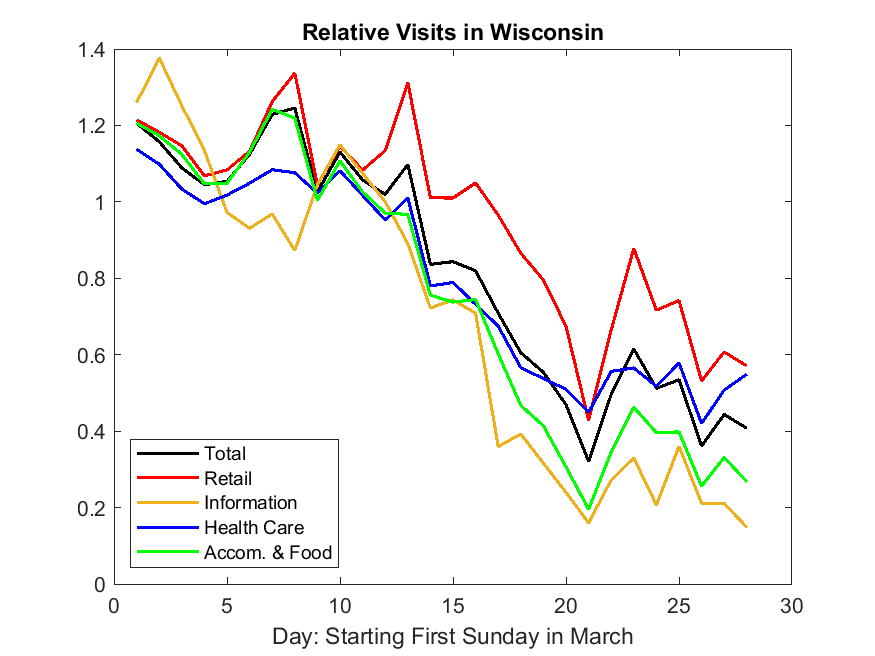
Here’s a quick summary piece we did analyzing same-location traffic in Wisconsin: https://crowe.wisc.edu/wp-content/uploads/sites/313/2020/04/activity.pdf
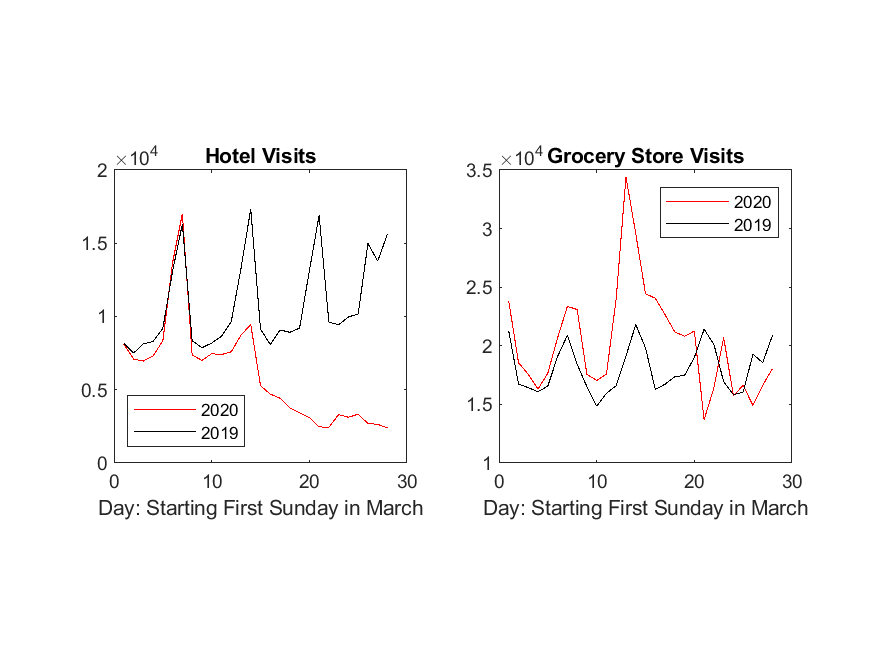
Big differences in declines across sectors and the count data is striking as well: travel was hit first then increasingly strong distancing measures & shutdowns starting around March 15 until shelter-in-place order March 25. Activity roughly leveled off last week.
That fits with some of my results too. February is pretty neat too—around Feb 25 there is a break for some counties, but not others. This was when Meissenneir (CDC) warned of community transmission.
Looks great @Noah_Williams_UW_Madison. We’ve added a link to our website: Featured Publications | SafeGraph
Would you mind if we pitched this to a few news publications?
Sure thing - Feel free to pitch it. We’ve pushed it around some here locally as well. We’ll be doing more with the data going forward. Thanks again for the access - so much to work with.
Hey Noah, This is really great work! As a thank you for sharing your work with the Consortium we’d like to send you a pair of SafeGraph socks. I’ll DM you the details.