Hi, I am working on Safegraph datasets and would like to know more about the data collection strategies (specifically, on “Spend - Aggregated Transaction Data”). Analyzing the data, I noticed that the spatial data coverage is increasing over time due to your business development, but I would like to comprehend how they implement the coverage. Is it by brand? By place/city/county/state?
I read that “SafeGraph implements it using NAICS codes and specifically selected POIs” ; does this mean that Safegraph is following a particular specific scheme to reach new NAICS and POIs? or is it casual ? how do they reach/acquire/find the new data?
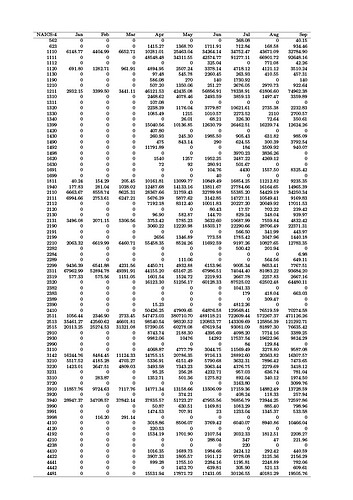
To be more specific in my question, I attach here an example. It is a table I created analyzing the data that illustrates the total monthly spending by NAICS code in some ZIP codes of Manhattan in 2022. It is evident that something changed in your coverage after March 2022.
My question aims to understand which are the causes of these huge changes.
If someone can help me on understanding this, it would be so appreciated!
Andrea
