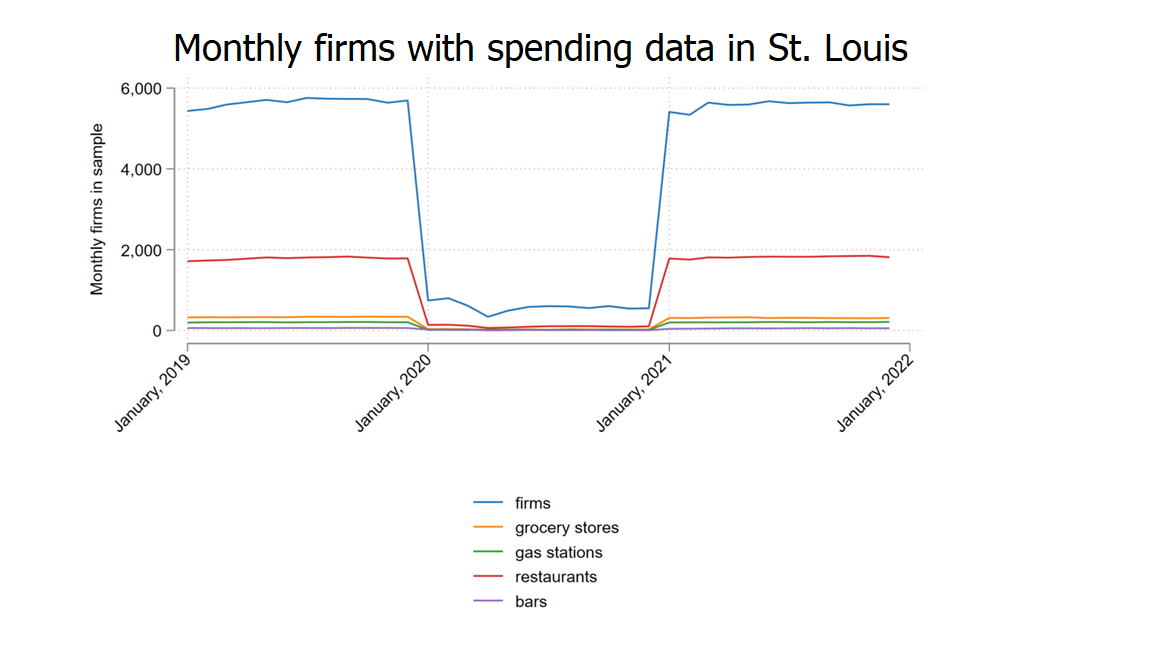
Hi, I am looking at the spend data for 2019-2021. The number of companies is fairly consistent over time, but in 2020 the number of companies with daily spending data drops by about 50%. However, daily spending reverts to 2019 levels in 2021. Has anyone else run across this issue, and/or know what caused the underlying differences?
Hey Michelle, are you looking at the counts of companies that have spend for every day of 2020? I would imagine that the drop is due to Covid.
Hi Ash,
No, I am looking at companies with spend data in a given month. I would have assumed it was from Covid if the drop occurred in March or April, but the drop occurs in January, 2020. I attached a graph that shows the change.
Thanks!
Michelle
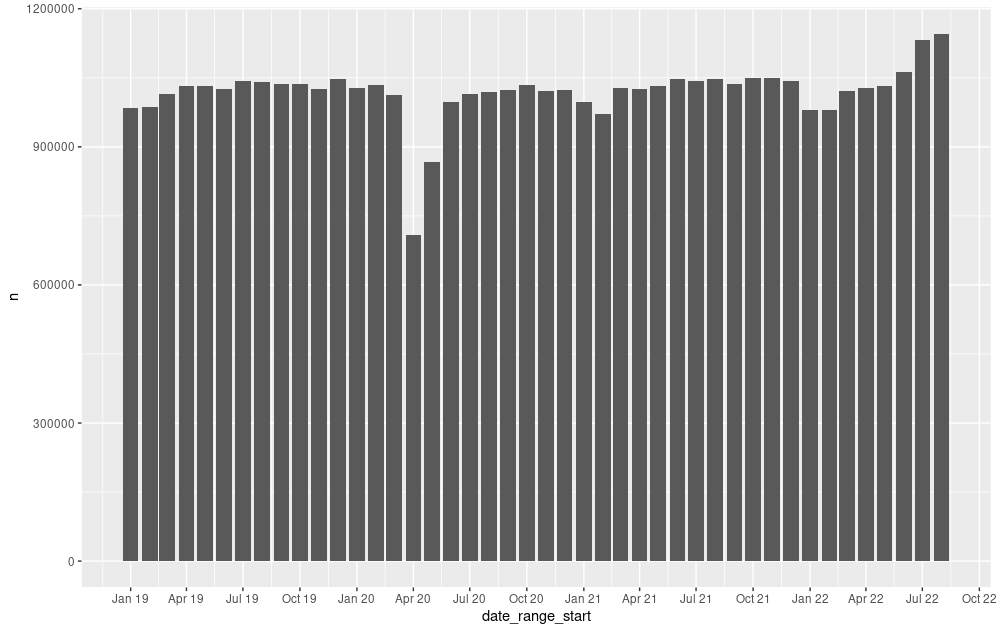
I’m also not seeing this in the data. Even filtered for Saint Louis, I am seeing numbers fairly consistent with Martin’s image.